September 04, 2025 a 03:15 pm

NTRS: Fibonacci Analysis - Northern Trust Corporation
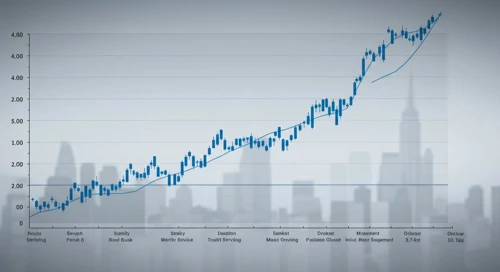
Northern Trust Corporation (NTRS) has shown resilience and potential during recent market fluctuations, especially with its diversified financial services. Analyzing the past months’ data reveals a significant upward trend, which could indicate strong investor confidence. However, attention should be paid to potential retracement levels that might provide support or act as barriers depending on future price movements.
Fibonacci Analysis
| Start Date | End Date | High Price (Date) | Low Price (Date) |
|---|---|---|---|
| 2025-04-04 | 2025-08-26 | 132.06 (2025-07-02) | 84.45 (2025-04-08) |
| Fibonacci Level | Price Level |
|---|---|
| 0.236 | 96.84 |
| 0.382 | 102.34 |
| 0.5 | 108.26 |
| 0.618 | 114.18 |
| 0.786 | 121.89 |
Currently, the price of NTRS is 129.7, suggesting it has surpassed the 0.786 Fibonacci level. It indicates strong bullish momentum that may continue if sustained above this level.
The stock chart shows Northern Trust Corp. reaching a technical overextended point. If the price holds above the 0.786 level, it can act as a potential support zone, with further upside potential.
Conclusion
The analysis of Northern Trust Corporation's stock reveals a robust bullish trend over the past few months. The breakthrough above the 0.786 Fibonacci level points towards a continuation of positive market sentiment. However, investors should remain vigilant of any macroeconomic changes that could impact overall market conditions. While current price movement suggests potential further gains, any reversal below key support levels may prompt a reevaluation. This setup provides a lucrative opportunity for those aligned with long-term bullish trends, yet necessitates cautious monitoring of any divergence in market indicators.
Smart Data Insight
Master the Perfect Entry & Exit for this Stock
Don't leave your profits to chance. Historically, this stock follows specific seasonal patterns that institutional traders use to maximize returns.
- ✅ Identify the "Golden Buying Window"
- ✅ Avoid high-risk correction cycles
- ✅ Backtested data from the last 20+ years