April 20, 2026 a 07:46 am

NTRS: Dividend Analysis - Northern Trust Corporation
Northern Trust Corporation demonstrates a strong dividend history with a consistent payout and moderate growth trend. Despite economic cycles, the company has maintained its dividend payments, reflecting management's commitment to delivering shareholder value. With a solid payout ratio and substantial market cap, Northern Trust remains a stable choice for dividend-oriented investors.
📊 Overview
Analyzing the dividend profile of Northern Trust Corporation reveals insights into its stability and yield potential.
| Key Details | Value |
|---|---|
| Sector | Financials |
| Dividend yield | 1.15% |
| Current dividend per share | 3.38 USD |
| Dividend history | 41 years |
| Last cut or suspension | None |
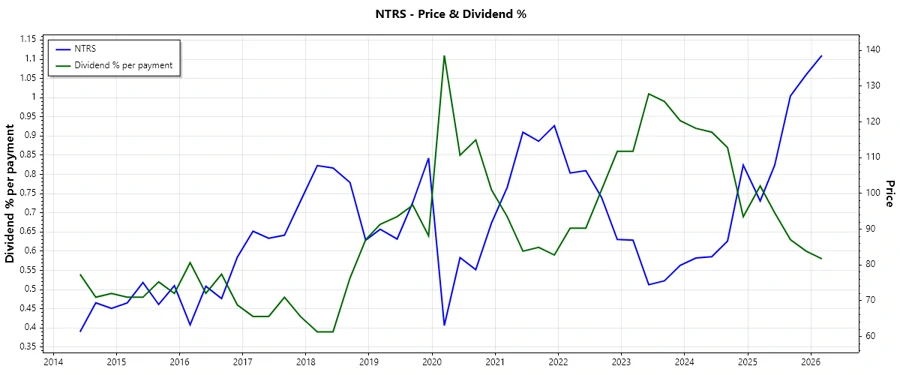
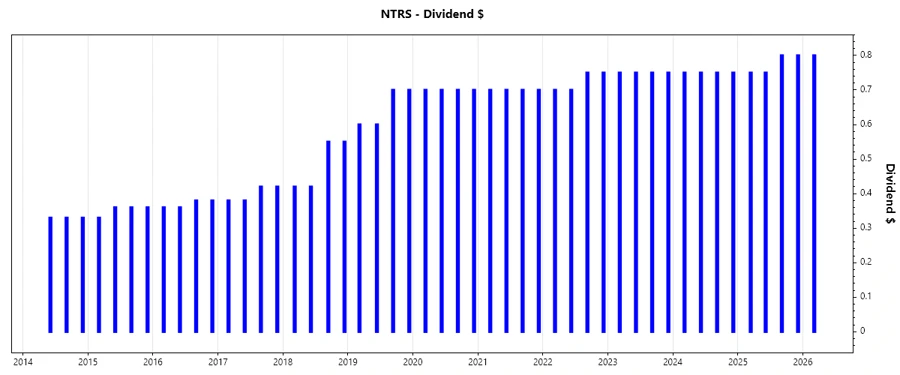
📉 Dividend History
The extensive history of dividends, spanning 41 years, underscores Northern Trust's resilience and capacity to reward its shareholders consistently.
| Year | Dividend per Share (USD) |
|---|---|
| 2026 | 0.80 |
| 2025 | 3.10 |
| 2024 | 3.00 |
| 2023 | 3.00 |
| 2022 | 2.90 |
📈 Dividend Growth
Examining the dividend growth rates provides vital insights into future income potential.
| Time | Growth |
|---|---|
| 3 years | 2.25% |
| 5 years | 2.06% |
The average dividend growth is 2.06% over 5 years. This shows moderate but steady dividend growth.
📈 Payout Ratio
The payout ratio gives us an indication of the sustainability of current dividend payments.
| Key figure | Ratio |
|---|---|
| EPS-based | 36.47% |
| Free cash flow-based | 13.22% |
The EPS-based payout ratio of 36.47% and the FCF payout ratio of 13.22% suggest a well-covered dividend with room for future growth.
🗣️ Cashflow & Capital Efficiency
Evaluating the cash flow and capital efficiency reveals the company's ability to support dividends through operational performance.
| Metric | 2025 | 2024 | 2023 |
|---|---|---|---|
| Free Cash Flow Yield | 21.31% | -5.97% | 11.15% |
| Earnings Yield | 6.78% | 9.85% | 6.33% |
| CAPEX to Operating Cash Flow | 1.34% | -153.40% | 25.74% |
| Stock-based Compensation to Revenue | 0% | 0% | 0% |
| Free Cash Flow / Operating Cash Flow Ratio | 98.66% | 253.40% | 74.26% |
Northern Trust's cash flow metrics exhibit volatility, but overall indicate a stable cash flow generation with a cautious capital allocation strategy.
💹 Balance Sheet & Leverage Analysis
A robust balance sheet is crucial for sustaining dividend payments and financial stability.
| Metric | 2025 | 2024 | 2023 |
|---|---|---|---|
| Debt-to-Equity | 1.27 | 1.25 | 1.45 |
| Debt-to-Assets | 9.27% | 10.28% | 11.43% |
| Debt-to-Capital | 55.90% | 55.57% | 59.16% |
| Net Debt to EBITDA | -13.90 | -8.71 | -11.35 |
| Current Ratio | 0.41 | 0.45 | 0.54 |
| Quick Ratio | 0.41 | 0.45 | 0.54 |
| Financial Leverage | 13.67 | 12.16 | 12.67 |
The balance sheet metrics suggest that Northern Trust maintains a high leverage but manages it effectively, ensuring liquidity and operational efficiency.
💪 Fundamental Strength & Profitability
Profitability ratios are key indicators of overall fiscal health and operational performance.
| Metric | 2025 | 2024 | 2023 |
|---|---|---|---|
| Return on Equity | 13.40% | 15.88% | 9.31% |
| Return on Assets | 0.98% | 1.31% | 0.73% |
| Net Margin | 12.15% | 12.79% | 9.14% |
| EBIT Margin | 16.30% | 16.75% | 12.09% |
| EBITDA Margin | 22.48% | 21.27% | 17.33% |
| Gross Margin | 56.54% | 52.24% | 55.70% |
| R&D to Revenue | 0% | 0% | 0% |
The performance metrics indicate robust profitability and capital efficiency, positioning Northern Trust advantageously in the financial sector.
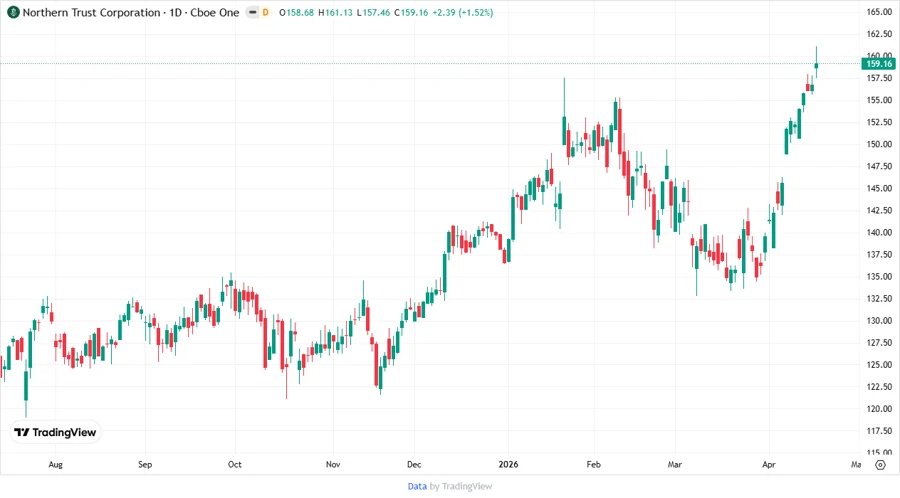
📈 Price Development
🔍 Dividend Scoring System
| Criterion | Score | Score Bar |
|---|---|---|
| Dividend yield | 3 | |
| Dividend Stability | 4 | |
| Dividend growth | 3 | |
| Payout ratio | 4 | |
| Financial stability | 4 | |
| Dividend continuity | 5 | |
| Cashflow Coverage | 3 | |
| Balance Sheet Quality | 4 |
Total Score: 30/40
⚠️ Rating
Northern Trust Corporation exemplifies a company with steady but limited dividend growth potential, robust financials, and a proven history of dividend resilience. With a good balance of yield and stability, it is recommended for conservative, income-focused investors.