February 24, 2026 a 02:46 am


NTRS: Dividend Analysis - Northern Trust Corporation
Northern Trust Corporation, with a robust heritage in the financial sector, stands out due to its consistent dividend payments. The company boasts a solid market cap of approximately $26.55 billion, with dividends playing a pivotal role in shareholder returns. In this analysis, we will delve into Northern Trust's dividend profile, evaluating its historical performance, growth metrics, and financial health to offer a comprehensive understanding of its potential as a dividend investment.
📊 Overview
With a dividend yield of 2.24% and a current dividend per share of $3.10, Northern Trust Corporation appeals to income-focused investors. The company has proudly maintained a stable dividend history for 41 years, a testament to its reliable financial management and commitment to rewarding shareholders.
| Metric | Value |
|---|---|
| Sector | Finance |
| Dividend yield | 2.24% |
| Current dividend per share | $3.10 USD |
| Dividend history | 41 years |
| Last cut or suspension | None |
🗣️ Dividend History
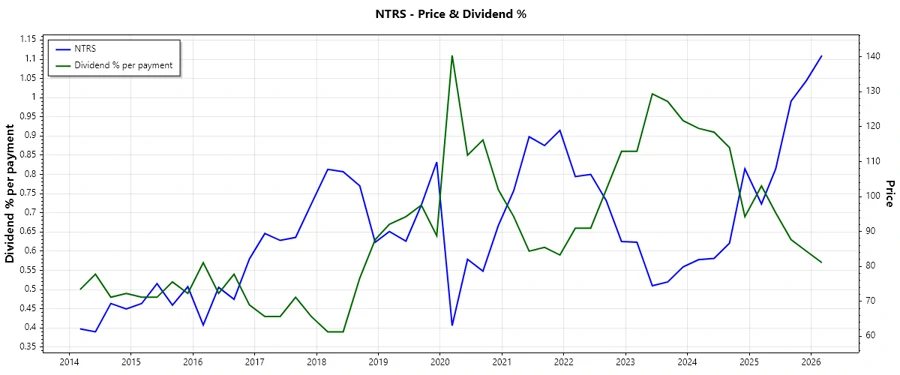
Northern Trust's track record of dividend distributions underscores its financial stability and management's shareholder-centric approach. Understanding historical payments helps investors predict future performance and assess the company's ability to sustain and grow its payouts.
| Year | Dividend per Share (USD) |
|---|---|
| 2026 | $0.80 |
| 2025 | $3.10 |
| 2024 | $3.00 |
| 2023 | $3.00 |
| 2022 | $2.90 |
📈 Dividend Growth
Dividend growth is critical for maintaining purchasing power and assessing the potential for increased future income. Northern Trust's moderate and consistent growth rates provide insights into its resilience and strategic planning.
| Time | Growth |
|---|---|
| 3 years | 2.25% |
| 5 years | 2.06% |
The average dividend growth is 2.06% over 5 years. This shows moderate but steady dividend growth.
⚠️ Payout Ratio
Evaluating payout ratios helps determine the sustainability of dividend payments relative to earnings and cash flow. It is a crucial gauge of financial health and future dividend capability.
| Key Figure | Ratio |
|---|---|
| EPS-based | 33.47% |
| Free cash flow-based | 34.19% |
Northern Trust's payout ratios are well within a comfortable range, indicating a balanced approach to dividend payments that prioritize both investor returns and reinvestment in growth.
📊 Cashflow & Capital Efficiency
Analyzing cash flow metrics provides insights into operational efficiency and the company's ability to fund dividends without leveraging or depleting cash reserves.
| Metric | 2023 | 2024 | 2025 |
|---|---|---|---|
| Free Cash Flow Yield | 11.15% | -5.97% | 0% |
| Earnings Yield | 6.33% | 9.85% | 6.78% |
| CAPEX to Operating Cash Flow | 25.74% | -153.40% | 0% |
| Stock-based Compensation to Revenue | 0% | 0% | 0% |
| Free Cash Flow / Operating Cash Flow Ratio | 74.26% | 2.53% | 0% |
Despite some fluctuations, Northern Trust's cash flow profile reflects resilience and adaptability, instrumental for sustaining dividends and boosting financial flexibility.
📊 Balance Sheet & Leverage Analysis
A sound balance sheet with controlled leverage indicates a company's ability to withstand economic fluctuations and fulfill debt obligations, key for long-term stability.
| Metric | 2023 | 2024 | 2025 |
|---|---|---|---|
| Debt-to-Equity Ratio | 1.449 | 1.251 | 1.268 |
| Debt-to-Assets Ratio | 11.43% | 10.28% | 9.27% |
| Debt-to-Capital Ratio | 59.16% | 55.57% | 55.90% |
| Net Debt to EBITDA | -11.35 | -8.71 | -13.90 |
| Current Ratio | 0.543 | 0.452 | 0.410 |
| Quick Ratio | 0.543 | 0.452 | 0.410 |
| Financial Leverage | 12.673 | 12.160 | 13.670 |
Northern Trust's leverage ratios are indicative of prudent financial management, ensuring liquidity while maintaining adequate buffers for unforeseen economic disruptions.
📊 Fundamental Strength & Profitability
Profitability metrics underscore the company's ability to generate income relative to expenses, critical for assessing intrinsic value and operational efficacy.
| Metric | 2023 | 2024 | 2025 |
|---|---|---|---|
| Return on Equity | 9.31% | 15.88% | 13.40% |
| Return on Assets | 0.73% | 1.31% | 0.98% |
| Return on Invested Capital | 3.19% | 6.15% | 5.04% |
| Net Margin | 9.14% | 12.79% | 12.15% |
| EBIT Margin | 12.09% | 16.75% | 16.30% |
| EBITDA Margin | 17.33% | 21.27% | 22.48% |
| Gross Margin | 55.70% | 52.24% | 56.54% |
| Research & Development to Revenue | 0% | 0% | 0% |
Northern Trust maintains admirable profitability metrics, affirming its competitive position and operational strength within the finance sector.
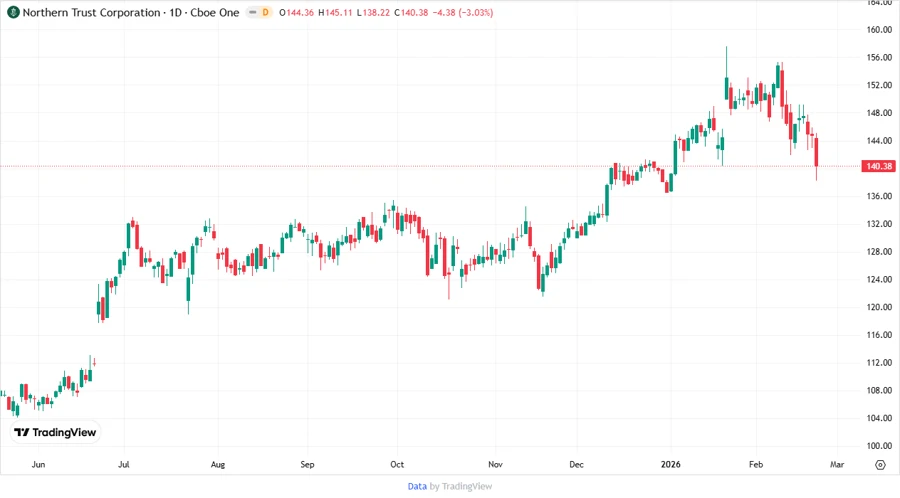
📈 Price Development
📉 Dividend Scoring System
| Criteria | Score | Score Bar |
|---|---|---|
| Dividend yield | 3 | |
| Dividend Stability | 5 | |
| Dividend growth | 3 | |
| Payout ratio | 4 | |
| Financial stability | 4 | |
| Dividend continuity | 5 | |
| Cashflow Coverage | 3 | |
| Balance Sheet Quality | 4 |
Total Score: 31/40
✅ Rating
Northern Trust Corporation’s consistent dividend payouts, strong corporate structure, and solid financial metrics make it a compelling proposition for dividend-focused investors. While the dividend growth rate is moderate, the company's commitment to maintaining and potentially increasing dividends supports a positive outlook for income-seeking shareholders. Recommended for conservative investors valuing stability and long-term capital appreciation.
Smart Data Insight
Master the Perfect Entry & Exit for this Stock
Don't leave your profits to chance. Historically, this stock follows specific seasonal patterns that institutional traders use to maximize returns.
- ✅ Identify the "Golden Buying Window"
- ✅ Avoid high-risk correction cycles
- ✅ Backtested data from the last 20+ years