December 10, 2025 a 11:31 am


NTRS: Dividend Analysis - Northern Trust Corporation
Northern Trust Corporation has showcased a consistent dividend track record, with over 40 years of dividend stability and resilience. Its financial fundamentals speak to a robust operational model, showcasing an attractive dividend yield and proven growth strategies. This analysis will delve into the diverse aspects of Northern Trust's dividend policies and fiscal health.
📊 Overview
| Metric | Details |
|---|---|
| Sector | Financials |
| Dividend yield | 2.33 % |
| Current dividend per share | 3.20 USD |
| Dividend history | 40 years |
| Last cut or suspension | 1999 |
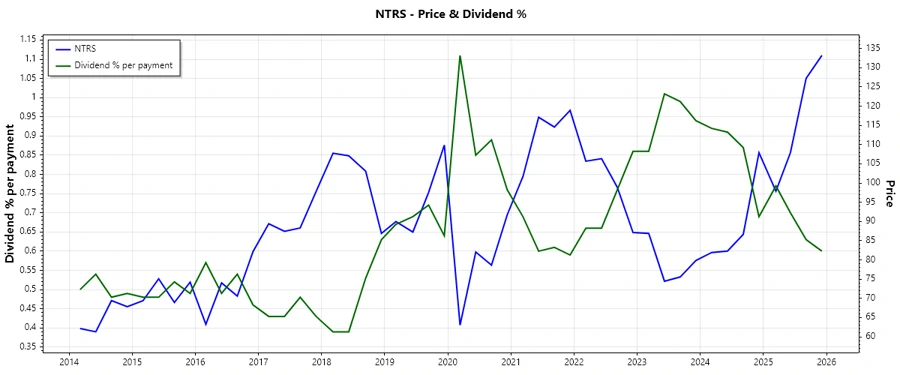
📈 Dividend History
The company's dividend history exemplifies a commitment to shareholder returns. Sustaining payouts through market fluctuations is vital for investor confidence and demonstrates fiscal discipline.
| Year | Dividend per share (USD) |
|---|---|
| 2025 | 3.10 |
| 2024 | 3.00 |
| 2023 | 3.00 |
| 2022 | 2.90 |
| 2021 | 2.80 |
📉 Dividend Growth
Evaluating the dividend growth rate informs potential future payouts. Growth sustainability showcases effective corporate strategy and potential for future yields.
| Time | Growth |
|---|---|
| 3 years | 2.33 % |
| 5 years | 2.90 % |
The average dividend growth is 2.90 % over 5 years. This shows moderate but steady dividend growth.
🗣️ Payout Ratio
The payout ratio offers insights into earnings distribution relative to dividends, showcasing fiscal sustainability. Lower ratios often indicate a company retains earnings for growth or rainy days.
| Key figure | Ratio |
|---|---|
| EPS-based | 35.23 % |
| Free cash flow-based | 28.65 % |
A 35.23 % payout ratio is considered conservative, suggesting healthy retention of earnings for operational needs and future growth prospects. Meanwhile, a 28.65 % FCF-based ratio further underscores fiscal discipline.
Cashflow & Capital Efficiency
Analyzing cash flow metrics provides a glimpse into operational efficiency and capital allocation. Key figures include free cash flow yield and earnings yield, which highlight asset utilization efficacy and investment attractiveness.
| Metric | 2024 | 2023 | 2022 |
|---|---|---|---|
| Free Cash Flow Yield | -5.97% | 11.15% | 9.05% |
| Earnings Yield | 9.85% | 6.33% | 7.25% |
| CAPEX to Operating Cash Flow | -153.39% | 25.74% | 30.24% |
| Stock-based Compensation to Revenue | 0% | 0% | 0% |
| Free Cash Flow / Operating Cash Flow Ratio | 2.53 | 0.74 | 0.70 |
The stability of cash flows, coupled with an efficient capital allocation strategy, reflects positively on Northern Trust's operational model and investment appeal.
Balance Sheet & Leverage Analysis
The balance sheet analysis provides insight into debt structures, liquidity, and capital management. Key ratios such as Debt-to-Equity and Current Ratio illuminate fiscal prudence and debt handling approach.
| Metric | 2024 | 2023 | 2022 |
|---|---|---|---|
| Debt-to-Equity | 1.25 | 1.45 | 1.32 |
| Debt-to-Assets | 10.28% | 11.43% | 9.58% |
| Debt-to-Capital | 55.57% | 59.16% | 56.87% |
| Net Debt to EBITDA | -8.71 | -11.35 | -13.70 |
| Current Ratio | 0 | 0.54 | 0.60 |
| Quick Ratio | 0.45 | 0.54 | 0.60 |
| Financial Leverage | 12.16 | 12.67 | 13.77 |
Through prudent debt management and reasonable leeway for financial leverage, Northern Trust maintains a stable financial structure that ensures sustained growth and liquidity.
Fundamental Strength & Profitability
The profitability metrics reflect the company's efficiency and effectiveness in generating profit relative to revenue and capital deployment. Margins and returns such as ROE and ROA signify the financial health and prowess of Northern Trust.
| Metric | 2024 | 2023 | 2022 |
|---|---|---|---|
| Return on Equity | 15.88% | 9.31% | 11.87% |
| Return on Assets | 1.31% | 0.73% | 0.86% |
| Net Profit Margin | 12.79% | 9.14% | 17.23% |
| EBIT Margin | 16.75% | 12.09% | 22.79% |
| EBITDA Margin | 21.27% | 17.33% | 29.93% |
| Gross Profit Margin | 52.24% | 55.70% | 87.07% |
| Research & Development to Revenue | 0% | 0% | 0% |
Northern Trust's strong return metrics and stability across profit margins underscore its proficiency in navigating market challenges and operational efficiency.
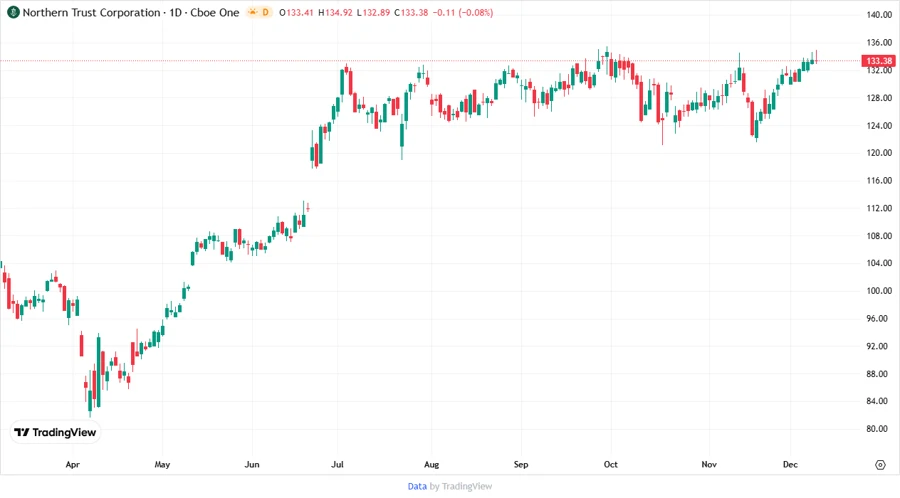
Price Development
✅ Dividend Scoring System
| Criterion | Score | Score Bar |
|---|---|---|
| Dividend yield | 3 | |
| Dividend Stability | 5 | |
| Dividend growth | 3 | |
| Payout ratio | 4 | |
| Financial stability | 4 | |
| Dividend continuity | 5 | |
| Cashflow Coverage | 4 | |
| Balance Sheet Quality | 4 |
Total Score: 32/40
⚠️ Rating
Based on the dividend and financial analysis, Northern Trust Corporation presents a compelling dividend profile characterized by reliability and moderate growth. With consistently prudent financial management, it can be regarded as a sound investment for income-focused investors seeking stability in the financial sector.