October 21, 2025 a 09:03 am


NTAP: Trend and Support & Resistance Analysis - NetApp, Inc.
NetApp, Inc., operating in the cloud and data-centric domains, has shown a mixed performance in recent months. The stock has experienced fluctuating trends, primarily driven by the broader tech sector movements and internal operational advancements. Technical analysis suggests areas of potential correction or upward momentum, depending on market conditions and company strategies. Investors should heed key indicators before making decisive moves in their portfolio.
Trend Analysis
The historical data indicates showcase an overall volatility in NetApp's stock prices. By calculating the 20-day and 50-day Exponential Moving Averages (EMA), the current trend can be identified. The data reflect a fluctuating pattern with short bursts of upward and downward movements.
| Date | Closing Price | Trend |
|---|---|---|
| 2025-10-20 | 117.24 | ⚖️ |
| 2025-10-17 | 119.07 | ⚖️ |
| 2025-10-16 | 119.4 | ⚖️ |
| 2025-10-15 | 121.47 | ⚖️ |
| 2025-10-14 | 120.55 | ⚖️ |
| 2025-10-13 | 118.86 | ⚖️ |
| 2025-10-10 | 113.94 | ⚖️ |
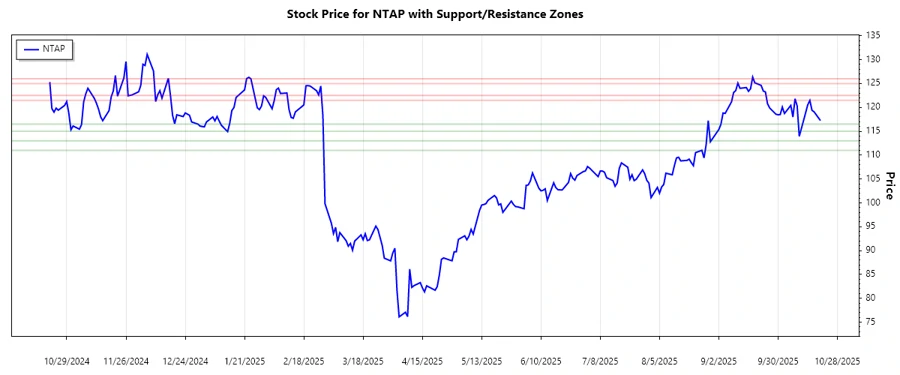
Based on the EMA calculations, the market is currently in a sideways trend due to near-similar values of EMA20 and EMA50. This suggests a consolidation phase where the market is preparing for a potential breakout. As seen in the chart below, the market remains sensitive to both upward and downward pressures.
Support and Resistance
Our technical analysis reveals critical support and resistance zones for NetApp. These zones are vital as they indicate levels at which the price action may stall due to a concentration of buy or sell orders.
| Zone Type | From | To |
|---|---|---|
| Support 1 | 115.00 | 116.50 |
| Support 2 | 111.00 | 113.00 |
| Resistance 1 | 121.50 | 122.50 |
| Resistance 2 | 125.00 | 126.00 |
Currently, the closing price is near the resistance zone, indicating a potential pullback if the price fails to break past the resistance. This could lead to more conservative trading, as investors await further market signals. As evidenced in the chart below, these zones provide crucial insights into potential trading opportunities.
Conclusion
In summary, NetApp appears to be in a consolidation phase with a determined balance between purchase momentum and resistance pressure. The identified support and resistance zones highlight significant psychological levels where price actions may seek validation. While there seems to be potential for breaking the current resistance, cautious optimism is advised. The trend and zone analysis suggest opportunities for both short-term trades and long-term investment strategies once market dynamics unfold. Investors are encouraged to watch for breakouts outside the entrenched zones, which signal more definitive market signals.