April 18, 2025 a 07:15 am


NTAP: Trend and Support & Resistance Analysis - NetApp, Inc.
As a company providing cloud-led data-centric services, NetApp, Inc. has a diverse range of products for data management and cloud operations. The recent stock performance shows potential opportunities for recovery or further risks depending on market conditions, particularly in the cloud segment. Understanding the technical trends and support-resistance metrics may provide insight for investors looking to time their engagement with NetApp's stock. Overall, this analysis will delve into identifying critical trends and market levels based on the daily data provided.
Trend Analysis
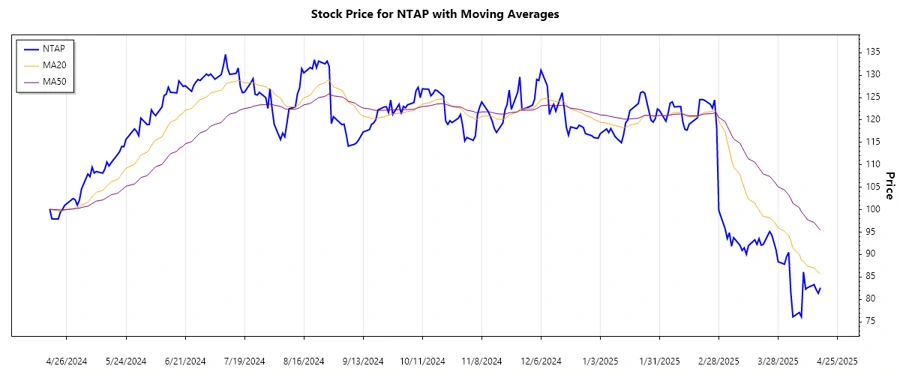
The analysis of NetApp's recent stock data reveals a predominantly declining trend. Calculating the EMA20 and EMA50 from the closing prices provides further trend insight. Here is the result:
| Date | Closing Price | Trend |
|---|---|---|
| 2025-04-17 | $82.61 | ▼ |
| 2025-04-16 | $81.35 | ▼ |
| 2025-04-15 | $82.18 | ▼ |
| 2025-04-14 | $83.28 | ▲ |
| 2025-04-11 | $82.64 | ▲ |
| 2025-04-10 | $82.28 | ▼ |
| 2025-04-09 | $86.10 | ▲ |
The overall trend indicates a bearish tendency as EMA20 is below the EMA50. Despite occasional upward movements, the pressure remains mostly downward.
Support and Resistance
Analyzing the provided data, we establish key support and resistance levels critical for potential future bounces or breakdowns.
| Zone | From | To |
|---|---|---|
| Support Zone 1 | $76.00 | $78.50 |
| Support Zone 2 | $81.00 | $83.50 |
| Resistance Zone 1 | $89.50 | $92.00 |
| Resistance Zone 2 | $96.00 | $98.50 |
Currently, the price hovers close to the upper edge of a support zone, suggesting crucial support action. Traders should watch for breach signals if breaking below.
Conclusion
The analysis of NetApp's stock shows a current downward trajectory with potential support nearby. While short-term volatilities are expected, breaking critical supports could lead to further downward pressure. Conversely, surpassing resistance levels might reignite interest in a bullish outlook. Investors should weigh the company's robust market presence in the cloud space against the current technical signals for decision-making. As always, staying abreast of broader market indicators will provide better guidance.
Smart Data Insight
Master the Perfect Entry & Exit for this Stock
Don't leave your profits to chance. Historically, this stock follows specific seasonal patterns that institutional traders use to maximize returns.
- ✅ Identify the "Golden Buying Window"
- ✅ Avoid high-risk correction cycles
- ✅ Backtested data from the last 20+ years