
June 22, 2026 a 07:43 pm

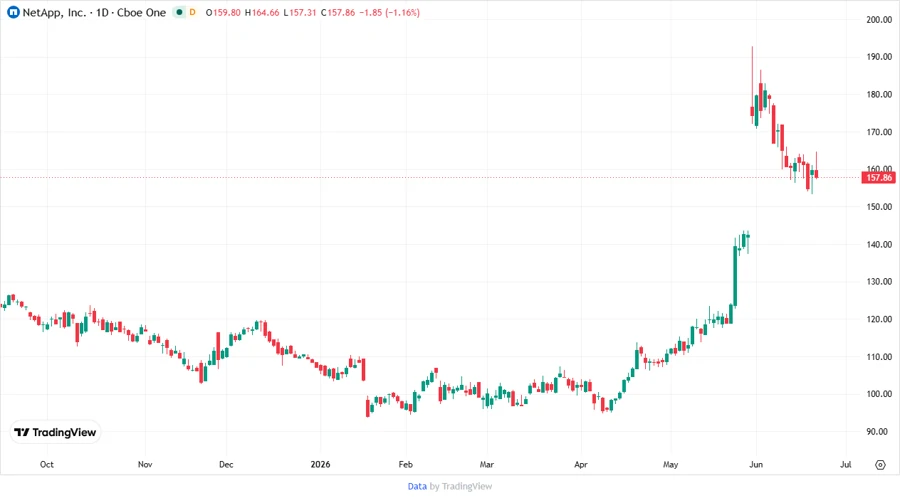
NTAP: Fundamental Ratio Analysis - NetApp, Inc.
NetApp, Inc., a stalwart in cloud-centric and data-driven services, presents an interesting opportunity for investors. Its rich portfolio across hybrid and public cloud environments positions it strongly for future growth. However, potential investors should consider the financial ratios and ratings for a comprehensive evaluation.
Fundamental Rating
The stock has a solid fundamental rating backed by strong returns on equity and assets. However, caution is advised given its debt to equity ratio.
| Category | Score | Visualization |
|---|---|---|
| Discounted Cash Flow | 4 | |
| Return On Equity | 5 | |
| Return On Assets | 5 | |
| Debt To Equity | 1 | |
| Price To Earnings | 3 | |
| Price To Book | 1 |
Historical Rating
Historically, the stock has maintained stability in its overall score with slight fluctuations, reflective of its steady financial performance.
| Date | Overall Score | DCF | ROE | ROA | D/E | P/E | P/B |
|---|---|---|---|---|---|---|---|
| 2026-06-22 | 3 | 4 | 5 | 5 | 1 | 3 | 1 |
| Previous | 0 | 4 | 5 | 5 | 1 | 3 | 1 |
Analyst Price Targets
Price targets indicate a positive outlook, with the median close to the consensus suggesting moderate optimism among analysts.
| High | Low | Median | Consensus |
|---|---|---|---|
| $200 | $89 | $171 | $167 |
Analyst Sentiment
The current analyst sentiment suggests a prevailing 'Hold' stance, while 'Buy' recommendations showcase an undercurrent of potential.
| Recommendation | Count | Visualization |
|---|---|---|
| Strong Buy | 0 | |
| Buy | 26 | |
| Hold | 36 | |
| Sell | 9 | |
| Strong Sell | 0 |
NetApp, Inc. stands out with its comprehensive data management solutions and robust financials, making it a potential candidate for investment. Its strengths in return metrics and data services offer growth potential, though debt and valuation ratios could reflect inherent risks. The mix of analyst ratings, while predominantly neutral, indicates room for upside should positive momentum in its key businesses continue.
Smart Data Insight
Master the Perfect Entry & Exit for this Stock
Don't leave your profits to chance. Historically, this stock follows specific seasonal patterns that institutional traders use to maximize returns.
- ✅ Identify the "Golden Buying Window"
- ✅ Avoid high-risk correction cycles
- ✅ Backtested data from the last 20+ years