March 07, 2026 a 11:44 am
NTAP: Fibonacci Analysis - NetApp, Inc.
NetApp, Inc. (ticker: NTAP) offers crucial cloud-led and data-centric services worldwide, primarily through its Hybrid Cloud and Public Cloud segments. Despite facing intense market competition, its robust product offerings sustain its significance in data management and storage. Recent trading activities reflect particular trends worth analyzing through Fibonacci retracement indicators, aiding investors in making informed decisions.
Fibonacci Analysis
| Detail | Information |
|---|---|
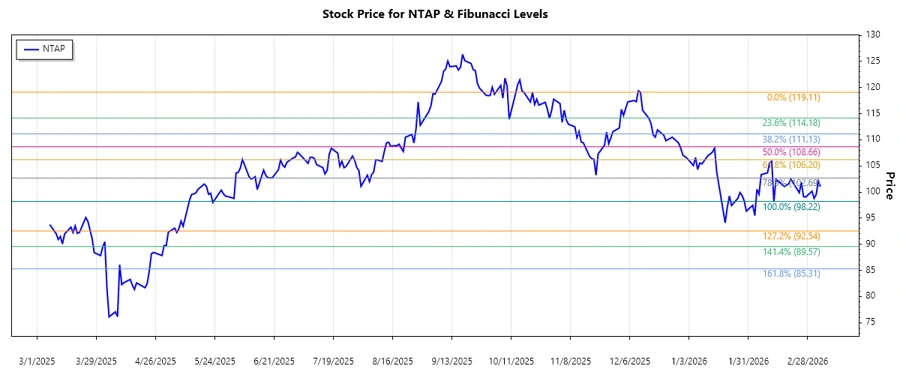
| Trend Type | Downward |
| Start Date | 2025-12-11 |
| End Date | 2026-03-06 |
| High Point | $119.11 on 2025-12-11 |
| Low Point | $98.22 on 2026-02-12 |
Fibonacci Levels
| Level | Price |
|---|---|
| 0.236 | $104.59 |
| 0.382 | $107.37 |
| 0.5 | $108.67 |
| 0.618 | $109.98 |
| 0.786 | $112.34 |
The current price of $101.06 is below the 0.236 retracement level, indicating it is not currently within a primary Fibonacci retracement zone. This suggests potential resistance is present, and downward pressure may remain until breaking above these critical levels.
Conclusion
NetApp is a key player in cloud and data management, leveraging its strong software suite to drive growth. Despite recent downward trends, the foundation for a rebound exists by breaking resistance barriers indicated by Fibonacci levels. Investors should monitor market signals closely to identify change patterns, as technical indicators signify both risks and opportunities. Through refined risk management strategies, NTAP remains a dynamic investment in a rapidly evolving industry.