
June 12, 2026 a 07:31 am

NTAP: Dividend Analysis - NetApp, Inc.
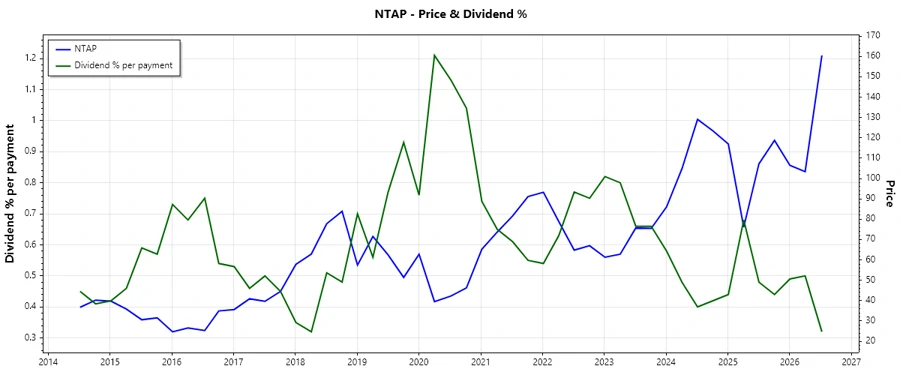
NetApp, Inc. has shown a stable dividend history with a current yield of 1.30%. With an uninterrupted dividend payment span of 14 years and no history of recent dividend cuts or suspensions, the company appears reliable. However, the relatively modest growth in dividends over the past 3 to 5 years reflects a more conservative approach to dividend increases.
Overview 📊
| Aspect | Details |
|---|---|
| Sector | Technology |
| Dividend Yield | 1.30% |
| Current Dividend per Share | 2.10 USD |
| Dividend History | 14 years |
| Last Cut or Suspension | None |
Dividend History 🗣️
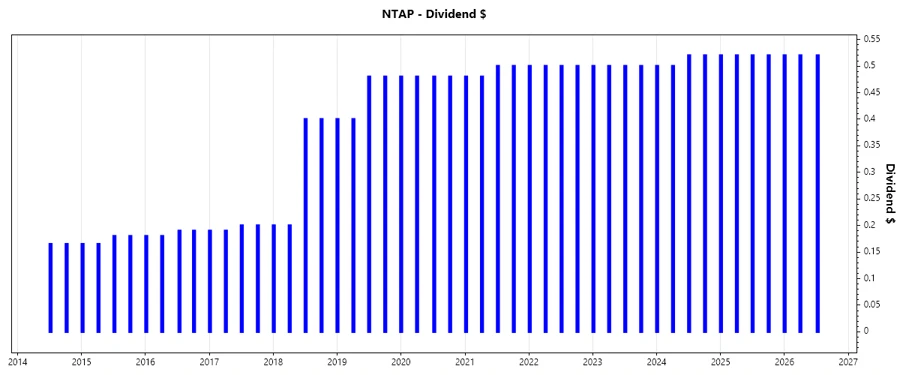
The longevity of NetApp's dividend payments underscores its commitment to returning value to shareholders consistently. This is a positive sign for income-focused investors looking for predictable cash flows. The absence of any recent dividend cuts signals financial stability. Maintaining a steady dividend is often indicative of a firm’s confidence in its future cash flows.
| Year | Dividend per Share (USD) |
|---|---|
| 2026 | 1.56 |
| 2025 | 2.08 |
| 2024 | 2.04 |
| 2023 | 2.00 |
| 2022 | 2.00 |
Dividend Growth 📈
The dividend growth of NetApp over the past few years is indicative of a moderate policy that aligns growth with earnings stability. This cautious yet steady growth is an encouraging sign for investors looking for increasing income streams over time.
| Time | Growth |
|---|---|
| 3 years | 1.32% |
| 5 years | 1.61% |
The average dividend growth is 1.61% over 5 years. This shows moderate but steady dividend growth.
Payout Ratio 📉
The payout ratio is a crucial indicator of dividend sustainability. An EPS-based payout ratio of 32.37% and an FCF-based ratio of 21.98% suggest that NetApp retains enough earnings to invest in future growth, while still rewarding shareholders.
| Key figure | Ratio |
|---|---|
| EPS-based | 32.37% |
| Free cash flow-based | 21.98% |
These ratios indicate a healthy balance between distributing profits and retaining capital for further growth, thus pointing towards a sustainable dividend policy.
Cashflow & Capital Efficiency ✅
Cash flow management is critical for sustaining operations and delivering consistent dividends. Metrics such as Free Cash Flow Yield and CAPEX to Operating Cash Flow ratios suggest how efficiently a company generates cash. NetApp's prudent cash flow strategies support its dividend payouts.
| Metric | 2026 | 2025 | 2024 |
|---|---|---|---|
| Free Cash Flow Yield | 8.73% | 7.31% | 7.20% |
| Earnings Yield | 5.96% | 6.48% | 4.64% |
| CAPEX to Operating Cash Flow | 9.58% | 11.16% | 9.20% |
| Stock-based Compensation to Revenue | 5.52% | 5.87% | 5.70% |
| Free Cash Flow / Operating Cash Flow Ratio | 90.42% | 88.84% | 90.80% |
These figures underscore NetApp's effective management of both free cash flow and capital resources, enhancing its ability to maintain dividend distributions.
Balance Sheet & Leverage Analysis ⚠️
The balance sheet reflects an organization's financial stability. Understanding leverage through ratios like Debt-to-Equity and Current Ratio helps evaluate a firm’s ability to meet its obligations and buffer against economic downturns.
| Metric | 2026 | 2025 | 2024 |
|---|---|---|---|
| Debt-to-Equity | 2.02 | 3.36 | 2.31 |
| Debt-to-Assets | 0.25 | 0.32 | 0.27 |
| Debt-to-Capital | 0.67 | 0.77 | 0.70 |
| Net Debt to EBITDA | 0.35 | 0.44 | 0.47 |
| Current Ratio | 1.44 | 1.25 | 1.19 |
| Quick Ratio | 1.39 | 1.22 | 1.15 |
NetApp's leverage profile indicates a robust capability to meet its liabilities, fostered by efficient asset management.
Fundamental Strength & Profitability 📊
Analyzing fundamental ratios like ROE and profit margins gives insights into performance. These metrics are crucial for evaluating profitability and operational efficiency.
| Metric | 2026 | 2025 | 2024 |
|---|---|---|---|
| Return on Equity | 94.45% | 114.04% | 86.04% |
| Return on Assets | 11.88% | 10.96% | 9.97% |
| Net Margin | 18.43% | 18.05% | 15.73% |
| EBIT Margin | 24.48% | 22.02% | 21.17% |
| EBITDA Margin | 27.36% | 25.72% | 25.24% |
| Gross Margin | 70.74% | 70.19% | 70.72% |
| Research & Development to Revenue | 14.31% | 15.40% | 16.42% |
NetApp's robust profitability and strategic investment in R&D underscore its competitive stance and adaptability in the tech sector.
Price Development 📈
Dividend Scoring System 🗳️
| Criteria | Score | Graph |
|---|---|---|
| Dividend yield | 3 | |
| Dividend Stability | 4 | |
| Dividend growth | 2 | |
| Payout ratio | 4 | |
| Financial stability | 4 | |
| Dividend continuity | 5 | |
| Cashflow Coverage | 4 | |
| Balance Sheet Quality | 4 |
Overall Score: 30/40
Rating 🎯
NetApp, Inc. demonstrates a balanced approach to dividend distribution, ensuring moderate growth and stable continuity that appeals to income-focused investors. With a solid foundation in financial stability and cash flow management, the company is well-positioned for ongoing dividend reliability. However, the relatively low dividend yield and modest growth may suit more conservative investment strategies. Recommended for those prioritizing sustainable income over rapid growth.
Smart Data Insight
Master the Perfect Entry & Exit for this Stock
Don't leave your profits to chance. Historically, this stock follows specific seasonal patterns that institutional traders use to maximize returns.
- ✅ Identify the "Golden Buying Window"
- ✅ Avoid high-risk correction cycles
- ✅ Backtested data from the last 20+ years