March 23, 2026 a 07:31 am

NTAP: Dividend Analysis - NetApp, Inc.
NetApp, Inc. presents a compelling dividend profile with a stable history and moderate growth over the years. It has consistently rewarded shareholders with dividends, showcasing its commitment to returning value. The company's strategic decisions and financial health underline its potential as a reliable investment, making it an attractive choice for dividend-focused portfolios.
📊 Overview
NetApp operates in a dynamic sector, providing a modest dividend yield of 2.06%. With a current dividend of $2.08 per share and a 14-year history of payouts, NetApp demonstrates consistency in dividend payments. The absence of recent cuts or suspensions suggests financial resilience and a commitment to shareholder returns.
| Metric | Details |
|---|---|
| Sector | Technology |
| Dividend yield | 2.06% |
| Current dividend per share | $2.08 |
| Dividend history | 14 years |
| Last cut or suspension | None |
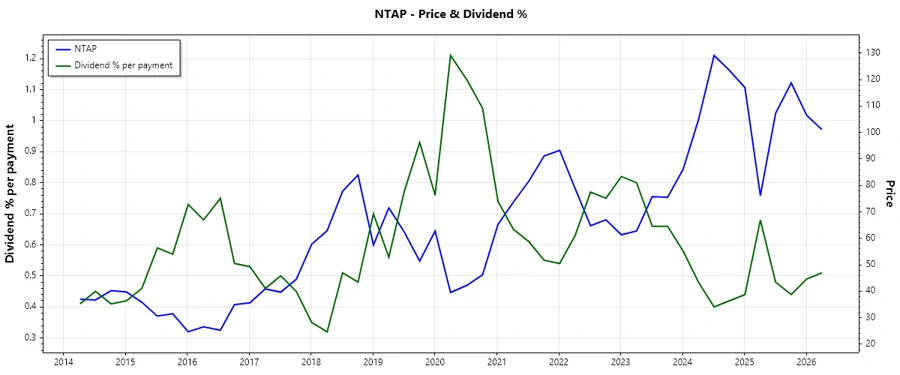
🗣️ Dividend History
Understanding NetApp’s dividend history is crucial as it highlights the company's commitment to its income-seeking investors. The reliable distribution reinforces investor confidence.
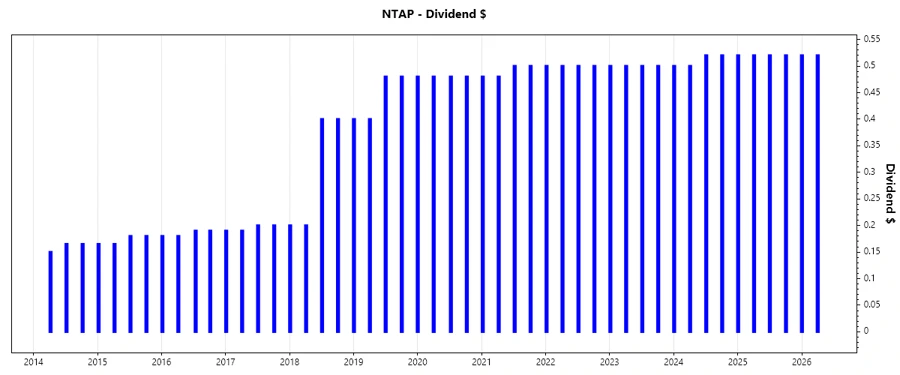
| Year | Dividend per Share (USD) |
|---|---|
| 2026 | 1.04 |
| 2025 | 2.08 |
| 2024 | 2.04 |
| 2023 | 2.00 |
| 2022 | 2.00 |
📈 Dividend Growth
NetApp’s dividend growth metric is essential for investors seeking increasing income streams. Over the last 3 years, the growth rate stood at 1.32%, slightly improving to 1.61% over five years, indicating moderate yet steady growth.
| Time | Growth |
|---|---|
| 3 years | 1.32% |
| 5 years | 1.61% |
The average dividend growth is 1.61% over 5 years. This shows moderate but steady dividend growth.
🔍 Payout Ratio
Payout ratios help evaluate the sustainability of dividends. NetApp reports a modest EPS-based payout ratio of 34% and an even lower FCF-based ratio of 26%. These figures suggest a well-covered dividend with room to grow.
| Key figure ratio | Details |
|---|---|
| EPS-based | 34% |
| Free cash flow-based | 26% |
The payout ratios indicate a conservative approach, which points to potential future increases in dividend payments, providing both security and growth for investors.
📊 Cashflow & Capital Efficiency
Analyzing cash flow and capital efficiency is imperative for understanding NetApp’s operational health. The free cash flow yield is competitive, and metrics like CAPEX to operating cash flow ensure effective asset utilization. The balance of earnings and free cash flow yield further assert the company's capital strength.
| Metric | 2025 | 2024 | 2023 |
|---|---|---|---|
| Free Cash Flow Yield | 7.31% | 7.20% | 6.28% |
| Earnings Yield | 6.48% | 4.64% | 9.22% |
| CAPEX to Operating Cash Flow | 11.16% | 9.20% | 21.59% |
| Stock-based Compensation to Revenue | 5.87% | 5.70% | 4.90% |
| Free Cash Flow / Operating Cash Flow Ratio | 88.84% | 90.80% | 78.41% |
Overall, NetApp exhibits efficient capital management, supporting its stable dividend payments and potential for growth.
🧐 Balance Sheet & Leverage Analysis
NetApp’s leverage ratios shed light on its debt management. The debt-to-equity is notably high, suggesting dependency on debt financing. However, good interest coverage indicates manageable debt levels.
| Metric | 2025 | 2024 | 2023 |
|---|---|---|---|
| Debt-to-Equity | 3.36 | 2.31 | 2.32 |
| Debt-to-Assets | 32.25% | 26.82% | 27.34% |
| Debt-to-Capital | 77.05% | 69.83% | 69.84% |
| Net Debt to EBITDA | 0.44 | 0.47 | 0.26 |
| Current Ratio | 1.26 | 1.19 | 1.35 |
| Quick Ratio | 1.22 | 1.15 | 1.30 |
| Financial Leverage | 10.41 | 8.63 | 8.47 |
Despite high leverage, NetApp’s well-structured debt and robust liquidity ratios reflect a balanced financial standing.
📊 Fundamental Strength & Profitability
Profit indicators such as return on equity, combined with strong margin metrics, reveal NetApp's fundamental strength and capacity to generate shareholder value from its investments.
| Metric | 2025 | 2024 | 2023 |
|---|---|---|---|
| Return on Equity | 114.04% | 86.04% | 109.92% |
| Return on Assets | 10.96% | 9.97% | 12.98% |
| Margins: Net | 18.05% | 15.73% | 20.03% |
| Margins: EBIT | 22.02% | 21.17% | 17.81% |
| Margins: EBITDA | 25.72% | 25.24% | 22.54% |
| Margins: Gross | 70.19% | 70.72% | 66.16% |
| Research & Development to Revenue | 15.40% | 16.42% | 15.03% |
Consistent profitability margins denote operational efficiency, reinforcing NetApp’s position as a fundamentally strong performer in its industry.
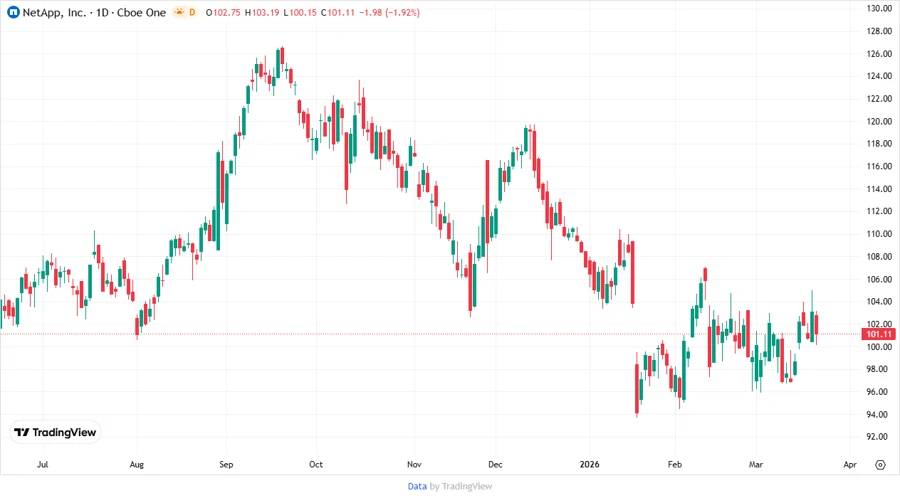
📉 Price Development
✅ Dividend Scoring System
| Category | Score | Score Indicator |
|---|---|---|
| Dividend yield | 3 | |
| Dividend Stability | 4 | |
| Dividend growth | 3 | |
| Payout ratio | 4 | |
| Financial stability | 4 | |
| Dividend continuity | 5 | |
| Cashflow Coverage | 5 | |
| Balance Sheet Quality | 4 |
Overall Score: 32/40
⭐ Rating
In conclusion, NetApp, Inc. is commendable for its consistent dividend payments and solid growth outlook. With a robust financial structure bolstering its payout capability, it represents a sound choice for dividend-centric investors aiming for a mixture of stability and growth.
Smart Data Insight
Master the Perfect Entry & Exit for this Stock
Don't leave your profits to chance. Historically, this stock follows specific seasonal patterns that institutional traders use to maximize returns.
- ✅ Identify the "Golden Buying Window"
- ✅ Avoid high-risk correction cycles
- ✅ Backtested data from the last 20+ years