February 21, 2026 a 03:15 pm**NSC: Fibonacci Analysis - Norfolk Southern Corporation**

NSC: Fibonacci Analysis - Norfolk Southern Corporation
Norfolk Southern Corporation has demonstrated a strong uptrend over the last few months, capitalizing on increased demand in the transportation sector. The company's strategic positioning in the rail transportation of diverse goods across the U.S. has contributed to its upward momentum. Analyzing historical price data suggests a continued bullish outlook unless critical support levels are breached.
Fibonacci Analysis
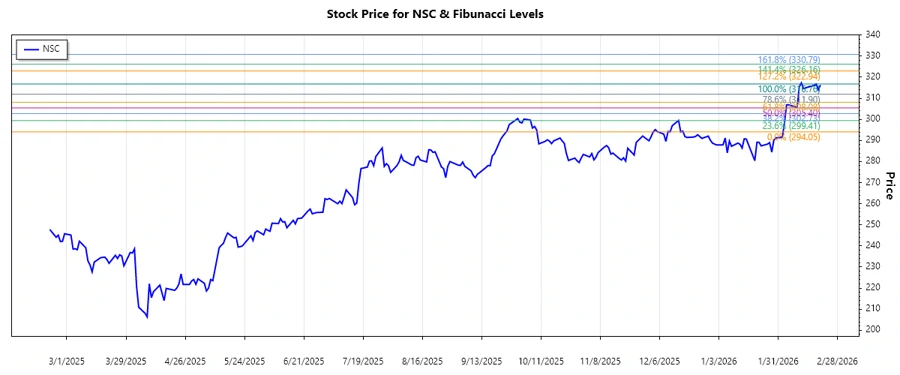
The recent data indicates a dominant uptrend in the stock of Norfolk Southern Corporation. Using the high of February 18, 2026 (316.76), and the low of December 3, 2025 (294.05), we calculate the Fibonacci retracement levels. These levels are vital for identifying potential support or resistance zones.
| Item | Details |
|---|---|
| Start Date | 2025-12-03 |
| End Date | 2026-02-18 |
| Highest Price | $316.76 (2026-02-18) |
| Lowest Price | $294.05 (2025-12-03) |
| Fibonacci Levels |
|
| Current Price | $316.23 |
| Retracement Zone | None (Above 0.786) |
| Interpretation | The current price is above the 0.786 level, indicating that the stock may face resistance near this level. A continued move above this level would be bullish. |
Conclusion
The stock of Norfolk Southern Corporation is enjoying a bullish phase, driven by its expansive operations and demand for rail transportation. Current analysis indicates potential minor resistance at the 0.786 Fibonacci level. If the price holds and breakthroughs occur beyond this zone, there could be a continuation of the uptrend. Investors should remain cautious of economic shifts that may impact demand within the rail sector. Overall, this stock remains a viable option within a diversified portfolio given its resilience and strategic industry position.