February 03, 2026 a 04:45 pm
NSC: Fibonacci Analysis - Norfolk Southern Corporation
Norfolk Southern Corporation, a major player in the rail transportation industry in the United States, has shown dynamic price movements over the past months. Analysis of its recent stock trends underscores the importance of technical indicators in forecasting potential future movements. By leveraging Fibonacci retracement levels, investors can pinpoint potential support and resistance levels vital for decision-making. This analysis offers a detailed look at recent price functionalities, and strategic opportunities.
Fibonacci Analysis
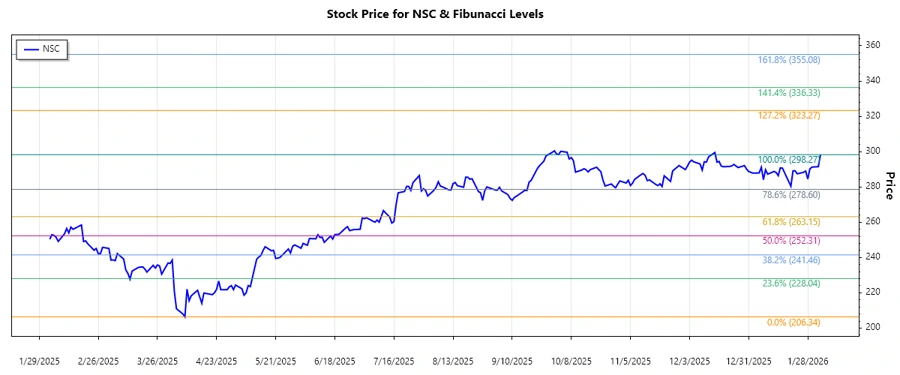
The data from the past few months indicates an upward trend for Norfolk Southern Corporation (NSC), with recent highs and lows providing pivotal points for Fibonacci level calculations. These levels are critical for identifying possible price retracements and guiding investment strategies.
| Trend Start Date | Trend End Date | High Price & Date | Low Price & Date |
|---|---|---|---|
| 2025-04-08 | 2026-02-03 | 298.27 (2026-02-03) | 206.34 (2025-04-08) |
| Fibonacci Level | Price Level |
|---|---|
| 0.236 | 228.62 |
| 0.382 | 242.93 |
| 0.5 | 252.31 |
| 0.618 | 261.69 |
| 0.786 | 275.00 |
The current price of 291.45 is above 0.786, indicating the potential continuation of an uptrend rather than a retracement. While such movement suggests higher support levels, attention should be paid to longer-term resistances formed at these Fibonacci levels.
Conclusion
The Norfolk Southern Corporation (NSC) has demonstrated a robust upward trajectory over the analyzed timeframe. With prices topping out at all-time highs, traders can expect pronounced interest at retracement levels, which can serve as new support in an ongoing rising market. Investors should remain vigilant of potential reversals at key Fibonacci prices or accelerated movements beyond these points. Considering the broader market context, NSC portrays growth opportunities with minimal immediate downside risk, yet market dynamics necessitate ongoing evaluation.