September 28, 2025 a 06:45 am
NSC: Fibonacci Analysis - Norfolk Southern Corporation
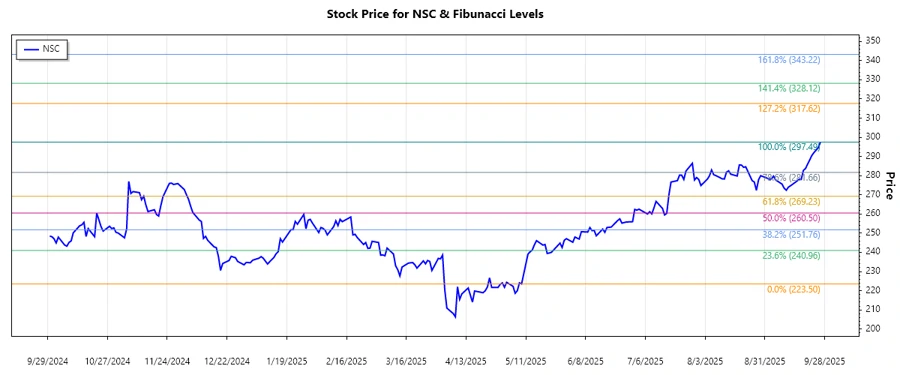
The Norfolk Southern Corporation's stock has experienced notable fluctuations over recent months. As a major player in the rail transportation sector, the company's financial health is closely tied to economic conditions affecting raw materials and goods transportation. Recent trends indicate a significant rise in the stock price, suggesting optimism about economic recovery and increased transportation activity.
Fibonacci Analysis
| Trend Dates | Price Points | Fibonacci Level |
|---|---|---|
| Start: 2025-05-09 End: 2025-09-26 |
High: $297.49 on 2025-09-26 Low: $223.50 on 2025-05-09 |
|
| The current price of $297.49 surpasses the retracement levels, indicating a breakout above the previous high, suggesting strong bullish momentum. | ||
Conclusion
Norfolk Southern Corporation's recent stock performance reflects a robust upward trend, characterized by a break above key Fibonacci retracement levels. The current price indicates sustained positive market sentiment, likely driven by confidence in the broader economic climate and the company’s strategic positioning in the rail industry. However, investors should remain aware of potential macroeconomic shifts that could impact transportation demand. While the upward trajectory presents a favorable opportunity, maintaining vigilance is advised to manage any unforeseen market dynamics.
Smart Data Insight
Master the Perfect Entry & Exit for this Stock
Don't leave your profits to chance. Historically, this stock follows specific seasonal patterns that institutional traders use to maximize returns.
- ✅ Identify the "Golden Buying Window"
- ✅ Avoid high-risk correction cycles
- ✅ Backtested data from the last 20+ years