June 22, 2026 a 07:46 am


NSC: Dividend Analysis - Norfolk Southern Corporation
Norfolk Southern Corporation, a leader in the transportation industry, boasts a robust and reliable dividend profile. With its substantial history of dividend payments and steady growth, it stands as a popular option for income-seeking investors. However, careful consideration of its payout ratios and growth metrics is essential for prospective investors. Despite the recent yield that may appear modest, its long-term stability offers reassurance.
Overview 📊
The dividend metrics for Norfolk Southern Corporation underscore a firm with a long-established payout rhythm within the transportation sector. It presents a dividend yield of 1.73%, with a current dividend per share of $5.40. Noteworthy is its 45 years of continuous dividend history, highlighting its commitment to shareholder returns, with no noted cuts or suspensions.
| Metric | Value |
|---|---|
| Sector | Transportation |
| Dividend yield | 1.73 % |
| Current dividend per share | 5.40 USD |
| Dividend history | 45 years |
| Last cut or suspension | None |
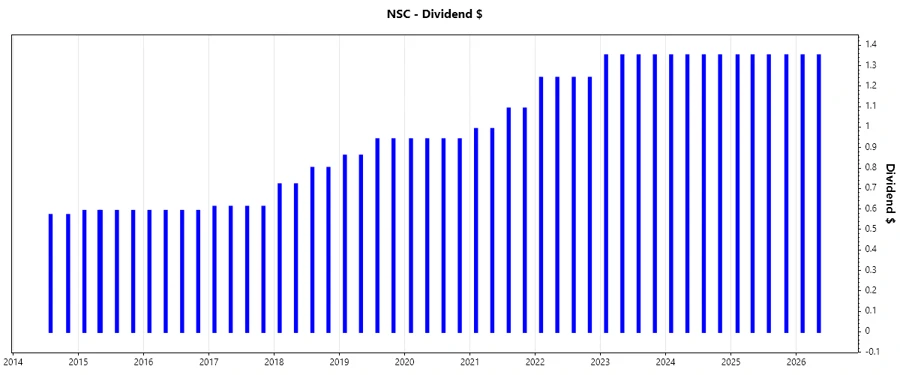
Dividend History 🗣️
Norfolk Southern has maintained a reliable streak of dividend payments, essential for assessing the sustainability of income streams for investors. Understanding past payments verifies consistency in returns, crucial for income-focused strategies.
| Year | Dividend Per Share |
|---|---|
| 2026 | 2.70 USD |
| 2025 | 5.40 USD |
| 2024 | 5.40 USD |
| 2023 | 5.40 USD |
| 2022 | 4.96 USD |
Dividend Growth 📈
Growth trends in dividends are pivotal for evaluating a company's future payout potential. Norfolk Southern exhibits a moderate but stable dividend growth, ensuring gradual shareholder value appreciation.
| Time | Growth |
|---|---|
| 3 years | 2.87 % |
| 5 years | 7.51 % |
The average dividend growth is 7.51 % over 5 years. This shows moderate but steady dividend growth.
Payout Ratio 📉
An effective payout ratio assessment provides perspective on a company's dividend sustainability and financial management. Norfolk Southern reports an EPS-based payout ratio of 45.57% and a free cash flow-based ratio of 32.91%, indicative of a balanced payout strategy ensuring dividends while reinvesting in growth opportunities.
| Key figure | Ratio |
|---|---|
| EPS-based | 45.57 % |
| Free cash flow-based | 32.91 % |
The ratios suggest prudent financial management, with sufficient earnings and cash flow coverage for dividend payments, balancing shareholder returns and investment in future growth.
Cashflow & Capital Efficiency ✅
A thorough analysis of cash flows and capital efficiency metrics reveals insights into the operational prowess and capital allocation discipline of Norfolk Southern. Its ability to generate sufficient operating cash flow and return on invested capital is pivotal for ongoing business expansion and shareholder value creation.
| Metric | 2023 | 2024 | 2025 |
|---|---|---|---|
| Free Cash Flow Yield | 1.55% | 3.15% | 3.32% |
| Earnings Yield | 3.41% | 4.94% | 4.43% |
| CAPEX to Operating Cash Flow | 73.89% | 58.76% | 50.54% |
| Stock-based Compensation to Revenue | 0% | 0% | 0% |
| Free Cash Flow / Operating Cash Flow Ratio | 26.11% | 41.24% | 49.46% |
The analysis reveals a competent strategy in reinvesting a substantial portion of operating cash flow back into CAPEX, while maintaining a healthy cash flow availability to support dividends.
Balance Sheet & Leverage Analysis 🔍
An examination of Norfolk Southern's leverage and liquidity sheds light on the company's financial flexibility and stability. Evaluating its debt profile and liquidity ratios is essential for understanding its capability to meet obligations and invest in growth.
| Metric | 2023 | 2024 | 2025 |
|---|---|---|---|
| Debt-to-Equity | 137.48% | 122.17% | 109.91% |
| Debt-to-Assets | 42.19% | 40.01% | 37.77% |
| Debt-to-Capital | 57.89% | 54.99% | 52.36% |
| Net Debt to EBITDA | 3.69 | 2.88 | 2.66 |
| Current Ratio | 1.24 | 0.90 | 0.85 |
| Quick Ratio | 1.14 | 0.82 | 0.78 |
| Financial Leverage | 3.26 | 3.05 | 2.91 |
Norfolk Southern demonstrates a well-managed leverage position with prudent debt levels, facilitating operational liquidity and maintaining resilience against market volatilities.
Fundamental Strength & Profitability 📈
Evaluating Norfolk Southern's return metrics and profitability margins is vital for understanding its efficiency in capital deployment and overall financial health. Analyzing these parameters helps gauge the company's competitive positioning and ability to generate shareholder returns.
| Metric | 2023 | 2024 | 2025 |
|---|---|---|---|
| Return on Equity | 14.29% | 18.33% | 18.48% |
| Return on Assets | 4.39% | 6.00% | 6.35% |
| Return on Invested Capital | 5.65% | 7.27% | 7.47% |
| Net Profit Margin | 15.03% | 21.63% | 23.59% |
| EBIT Margin | 25.02% | 34.12% | 36.59% |
| EBITDA Margin | 35.70% | 45.28% | 48.03% |
| Gross Margin | 23.10% | 31.05% | 42.43% |
| R&D to Revenue | 0% | 0% | 0% |
The company's historical profitability metrics reflect a strong operational model, underpinning an impressive margin expansion over recent years.
Price Development 💹
Dividend Scoring System 🔔
| Criterion | Score | |
|---|---|---|
| Dividend Yield | 3 | |
| Dividend Stability | 5 | |
| Dividend Growth | 4 | |
| Payout Ratio | 4 | |
| Financial Stability | 4 | |
| Dividend Continuity | 5 | |
| Cashflow Coverage | 4 | |
| Balance Sheet Quality | 4 |
Total Score: 33 / 40
Rating ⭐
Norfolk Southern Corporation presents an enticing proposition for dividend-focused investors, backed by a resilient performance history and methodical growth trajectory. Despite its moderate yield, the firm's affirmed commitment to continuous payouts, underlined by robust financials, lays the foundation for stable income generation and potential capital appreciation. Investors are advised to incorporate this stable dividend stock into a well-diversified portfolio.
Smart Data Insight
Master the Perfect Entry & Exit for this Stock
Don't leave your profits to chance. Historically, this stock follows specific seasonal patterns that institutional traders use to maximize returns.
- ✅ Identify the "Golden Buying Window"
- ✅ Avoid high-risk correction cycles
- ✅ Backtested data from the last 20+ years