December 03, 2025 a 07:31 am


NSC: Dividend Analysis - Norfolk Southern Corporation
Norfolk Southern Corporation showcases a respectable dividend profile with a current yield of approximately 1.90%. Its 44-year history of uninterrupted dividends signals a commitment to returning capital to shareholders. Despite the low current yield, its potential lies in the stability and historical growth of its payments. The company’s strategic approach seems focused on maintaining this reliability while aiming for moderate growth, setting a dependable income stream foundation for its investors. However, caution is advised as the latest fluctuations in the logistics sector could present future challenges.
📊 Overview
| Metric | Details |
|---|---|
| Sector | Transportation |
| Dividend yield | 1.90% |
| Current dividend per share | 5.40 USD |
| Dividend history | 44 years |
| Last cut or suspension | 2016 |
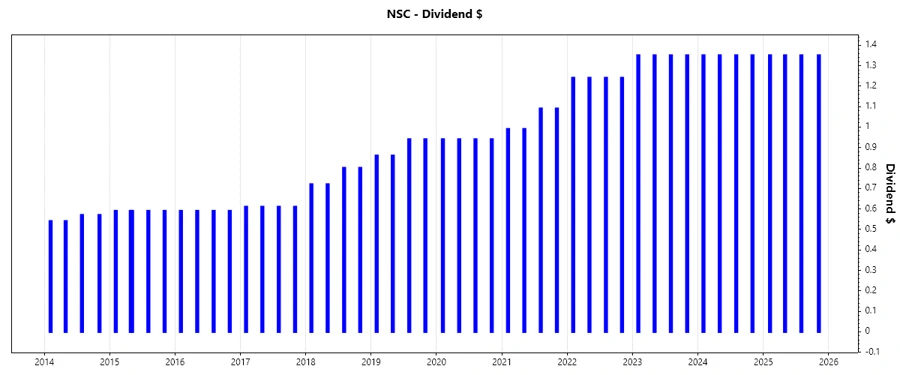
🗣️ Dividend History
The long-standing dividend history of Norfolk Southern Corporation is a testament to its commitment to shareholder returns. A 44-year streak without cuts is impressive, outpacing many peers and offering reassurance of its dividend reliability.
| Year | Dividend per Share (USD) |
|---|---|
| 2025 | 5.40 |
| 2024 | 5.40 |
| 2023 | 5.40 |
| 2022 | 4.96 |
| 2021 | 4.16 |
📈 Dividend Growth
The modest growth rates in dividends for the last 3 and 5 years indicate a stable but cautious approach towards dividend increments. This approach could appeal to investors seeking consistency in income growth over larger jumps.
| Time | Growth |
|---|---|
| 3 years | 9.09% |
| 5 years | 8.45% |
The average dividend growth is 8.45% over 5 years. This shows moderate but steady dividend growth.
✅ Payout Ratio
Payout ratios provide insights into the portion of earnings and free cash flow returned to investors via dividends. A healthy payout ratio often suggests the sustainability of dividends.
| Key figure | Ratio |
|---|---|
| EPS-based | 40.91% |
| Free cash flow-based | 57.73% |
The EPS-based payout ratio of 40.91% indicates ample coverage of dividends by earnings, while the Free Cash Flow-based ratio of 57.73% suggests a solid but more constrained cash flow backing for dividend payouts.
⚙️ Cashflow & Capital Efficiency
The cash flow metrics are paramount in assessing the company's ability to maintain current dividend levels and to invest in growth opportunities. The data reflect operational efficiency and capital investment strategies.
| Year | 2024 | 2023 | 2022 |
|---|---|---|---|
| Free Cash Flow Yield | 3.15% | 1.55% | 3.93% |
| Earnings Yield | 4.94% | 3.41% | 5.65% |
| CAPEX to Operating Cash Flow | 0.59 | 0.74 | 0.46 |
| Stock-based Compensation to Revenue | 0% | 0% | 0.42% |
| Free Cash Flow / Operating Cash Flow Ratio | 41.24% | 26.11% | 53.86% |
The company's ability to generate free cash flow relative to its operating cash flow suggests robust capital management and highlights efficacious operating activities, thus underpinning its capital efficiency.
🧾 Balance Sheet & Leverage Analysis
The robustness of a company's balance sheet and its leverage ratios are key determinants of financial health and risk profile, influencing future growth and dividend sustainability.
| Year | 2024 | 2023 | 2022 |
|---|---|---|---|
| Debt-to-Equity | 1.22 | 1.37 | 1.22 |
| Debt-to-Assets | 0.40 | 0.42 | 0.40 |
| Debt-to-Capital | 0.55 | 0.58 | 0.55 |
| Net Debt to EBITDA | 2.89 | 3.69 | 2.50 |
| Current Ratio | 0.90 | 1.24 | 0.76 |
| Quick Ratio | 0.82 | 1.14 | 0.66 |
| Financial Leverage | 3.05 | 3.26 | 3.05 |
Norfolk Southern Corporation's leverage ratios suggest moderate but manageable debt levels, ensuring flexibility to fulfill short-term obligations and fund operations sustainably.
🚀 Fundamental Strength & Profitability
Analyzing profitability ratios such as margins and returns is critical in understanding Norfolk Southern's ability to efficiently translate revenue into profits, thus supporting its dividend strategy.
| Year | 2024 | 2023 | 2022 |
|---|---|---|---|
| Return on Equity | 18.33% | 14.29% | 25.68% |
| Return on Assets | 6.00% | 4.39% | 8.41% |
| Margins: Net | 21.63% | 15.03% | 25.66% |
| Margins: EBIT | 34.12% | 25.02% | 37.83% |
| Margins: EBITDA | 45.28% | 35.70% | 47.41% |
| Margins: Gross | 31.05% | 23.10% | 37.13% |
| R&D to Revenue | 0% | 0% | 0% |
The company's strong return on equity and revenue efficiency indicators reflect robust operational performance, essential for sustaining its dividend policy and financial health.
📉 Price Development
🔍 Dividend Scoring System
| Criteria | Score | Score Bar |
|---|---|---|
| Dividend yield | 3 | |
| Dividend Stability | 5 | |
| Dividend Growth | 4 | |
| Payout Ratio | 5 | |
| Financial Stability | 4 | |
| Dividend Continuity | 5 | |
| Cashflow Coverage | 4 | |
| Balance Sheet Quality | 4 |
Total Score: 34/40
🏆 Rating
Norfolk Southern Corporation is rated as a strong dividend payer, offering a stable income source backed by a robust financial foundation. Investors seeking reliable dividends with moderate growth potential will find NSC an appealing choice, although the relatively low yield necessitates a focus on long-term stability gains. Strategic diversification and risk management will be key for optimizing investment returns in this equity.