November 18, 2025 a 11:32 am


NSC: Dividend Analysis - Norfolk Southern Corporation
Norfolk Southern Corporation showcases a robust dividend profile, underpinned by its consistent dividend payments for over four decades. Despite facing economic fluctuations, the resilience and reliability in its dividend distributions highlight its strong financial health and commitment to shareholder returns.
📊 Overview
Norfolk Southern Corporation, operating in the transportation sector, presents a stable dividend yield of 1.90% with a current dividend of $5.40 per share. The firm has demonstrated consistent dividend payments over 44 years, evidencing resilience except for a dividend cut or suspension in 2016.
| Metric | Value |
|---|---|
| Sector | Transportation |
| Dividend yield | 1.90% |
| Current dividend per share | 5.40 USD |
| Dividend history | 44 years |
| Last cut or suspension | 2016 |
🗣️ Dividend History
The dividend history of Norfolk Southern showcases a commitment to shareholder value through persistent returns. A history of consistent payouts fosters investor confidence and contributes to the overall perception of financial stability.
| Year | Dividend per Share (USD) |
|---|---|
| 2025 | 5.40 |
| 2024 | 5.40 |
| 2023 | 5.40 |
| 2022 | 4.96 |
| 2021 | 4.16 |
📈 Dividend Growth
The growth in dividends over time is a key indicator of a company's financial health and management's confidence in future cash flows. Norfolk Southern has progressively increased its dividends, illustrating its capability to generate additional value for its shareholders.
| Time | Growth |
|---|---|
| 3 years | 9.09% |
| 5 years | 8.45% |
The average dividend growth is 8.45% over 5 years. This shows moderate but steady dividend growth.
✅ Payout Ratio
Payout ratios indicate the sustainability of a company's dividend payments from its earnings and free cash flows. With a manageable EPS-based payout ratio of 40.91% and a FCF-based payout ratio of 57.73%, Norfolk Southern maintains a balance between reinvesting in operations and rewarding shareholders.
| Key figure | Ratio |
|---|---|
| EPS-based | 40.91% |
| Free cash flow-based | 57.73% |
The payout ratios suggest a sound approach to managing earnings and cash flows. These figures indicate that dividends are well-covered by both earnings and cash flow, providing a cushion against cyclical downturns.
📉 Cashflow & Capital Efficiency
Cash flow and capital efficiency metrics assert the company's proficiency in generating cash relative to its expenses, investments, and shareholder distributions. Evaluating cash flow yields and capital efficiency ratios provides a comprehensive understanding of financial robustness.
| Year | 2024 | 2023 | 2022 |
|---|---|---|---|
| Free Cash Flow Yield | 3.15% | 1.55% | 3.93% |
| Earnings Yield | 4.94% | 3.41% | 5.65% |
| CAPEX to Operating Cash Flow | 58.76% | 73.89% | 46.14% |
| Stock-based Compensation to Revenue | 0% | 0% | 0.42% |
| Free Cash Flow / Operating Cash Flow Ratio | 41.24% | 26.11% | 53.86% |
The stability of Norfolk Southern's cash flows indicates a resilient ability to cover its obligations while maintaining investment flexibility. The capital efficiency metrics further showcase a solid allocation of resources.
⚖️ Balance Sheet & Leverage Analysis
Balance sheet ratios provide insight into financial stability, debt levels, and the company's ability to meet short-term obligations. Analyzing leverage ratios helps assess the financial risk and creditworthiness.
| Year | 2024 | 2023 | 2022 |
|---|---|---|---|
| Debt-to-Equity | 1.22 | 1.37 | 1.22 |
| Debt-to-Assets | 40.01% | 42.19% | 40.10% |
| Debt-to-Capital | 54.99% | 57.89% | 55.05% |
| Net Debt to EBITDA | 2.89 | 3.69 | 2.50 |
| Current Ratio | 0.90 | 1.24 | 0.76 |
| Quick Ratio | 0.82 | 1.14 | 0.66 |
| Financial Leverage | 3.05 | 3.26 | 3.05 |
Norfolk Southern's leverage ratios reflect cautious debt management, bolstering financial resilience. The stability of these metrics indicates prudent balance sheet management and favorable liquidity standing.
🏦 Fundamental Strength & Profitability
Evaluating fundamental strength and profitability through margins and returns provides insight into operational efficiency and effectiveness in generating earnings relative to invested capital.
| Year | 2024 | 2023 | 2022 |
|---|---|---|---|
| Return on Equity | 18.33% | 14.29% | 25.68% |
| Return on Assets | 6.00% | 4.39% | 8.41% |
| Margins | |||
| Net Margin | 21.63% | 15.03% | 25.66% |
| EBIT Margin | 34.12% | 25.02% | 37.83% |
| EBITDA Margin | 45.28% | 35.70% | 47.41% |
| Gross Margin | 31.05% | 23.10% | 37.14% |
| Research & Development to Revenue | 0% | 0% | 0% |
Norfolk Southern's profitability metrics highlight strong operational efficiency with commendable returns on equity and assets. The margins underline effective cost management and enhance shareholder confidence.
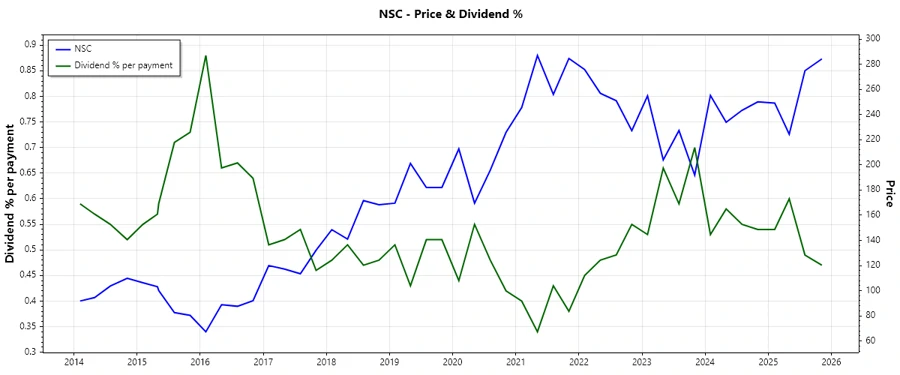
🌄 Price Development
🧮 Dividend Scoring System
| Category | Score | Indicator |
|---|---|---|
| Dividend Yield | 3 | |
| Dividend Stability | 4 | |
| Dividend Growth | 3 | |
| Payout Ratio | 4 | |
| Financial Stability | 4 | |
| Dividend Continuity | 5 | |
| Cashflow Coverage | 3 | |
| Balance Sheet Quality | 4 |
Total Score: 30/40
📝 Rating
Norfolk Southern Corporation exhibits a robust dividend profile with consistent and stable growth over the years. Despite a moderate dividend yield, the company maintains strong financials and a commendable balance sheet, ensuring sustained dividend payouts. Investors seeking a reliable return with potential for steady growth may find Norfolk Southern Corporation an attractive addition to their portfolio.
Smart Data Insight
Master the Perfect Entry & Exit for this Stock
Don't leave your profits to chance. Historically, this stock follows specific seasonal patterns that institutional traders use to maximize returns.
- ✅ Identify the "Golden Buying Window"
- ✅ Avoid high-risk correction cycles
- ✅ Backtested data from the last 20+ years