October 18, 2025 a 02:47 am
NSC: Dividend Analysis - Norfolk Southern Corporation
Norfolk Southern Corporation presents a robust investment prospect for income-focused investors, with a remarkable 44-year history of dividend consistency. The company’s dividend yield, although moderate, is supported by a sound payout ratio and continuous dividend growth. Investors may find the financial stability and sustainability of dividend payouts particularly appealing.
📊 Overview
Norfolk Southern Corporation operates in a highly strategic sector with a focus on long-term value creation. Its current dividend yield of 1.96% is indicative of reliable income, supported by a dividend per share of $5.40. Notably, the company has maintained a consistent dividend history for 44 years, reflecting a strong commitment to returning value to shareholders. The absence of recent dividend cuts or suspensions further underscores this stability.
| Factor | Value |
|---|---|
| Sector | N/A |
| Dividend yield | 1.96 % |
| Current dividend per share | 5.40 USD |
| Dividend history | 44 years |
| Last cut or suspension | None |
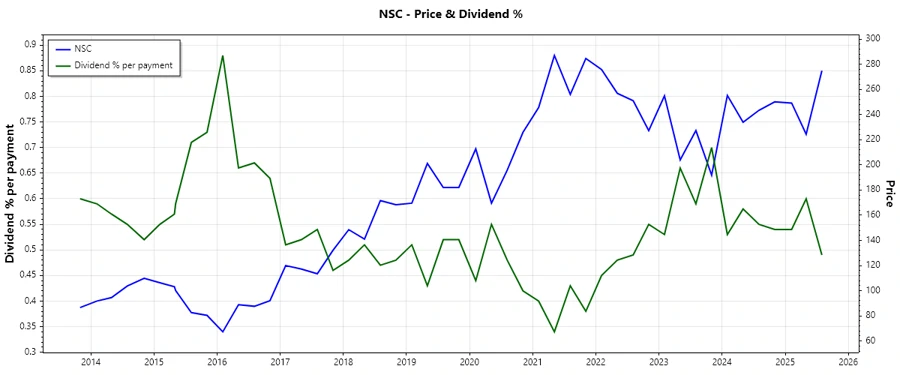
📈 Dividend History
The steady growth and reliability of Norfolk Southern’s dividends are crucial to evaluating its financial health and shareholder value. The company’s lengthy dividend history without interruptions suggests a resilient fiscal strategy focused on shareholder returns.
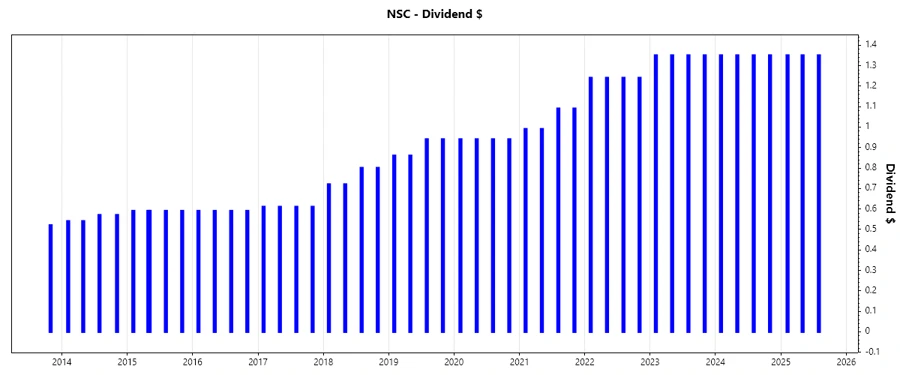
| Year | Dividend per Share (USD) |
|---|---|
| 2025 | 4.05 |
| 2024 | 5.40 |
| 2023 | 5.40 |
| 2022 | 4.96 |
| 2021 | 4.16 |
📈 Dividend Growth
Norfolk Southern’s dividend growth trajectory over the past years underscores its commitment to increasing shareholder value. The average dividend growth stood at approximately 9.09% over the last 3 years and at 8.45% over the last 5 years, reflecting moderate but stable enhancement in investor returns.
| Period | Growth |
|---|---|
| 3 years | 9.09 % |
| 5 years | 8.45 % |
The average dividend growth is 8.45 % over 5 years. This shows moderate but steady dividend growth.
👨💼 Payout Ratio
Understanding payout ratios is imperative for evaluating dividend sustainability. Norfolk Southern’s payout ratio based on EPS is 36.27%, while the free cash flow-based payout ratio is at 59.87%. These figures indicate a balanced approach to dividend distribution, maintaining sufficient capital for reinvestment and growth.
| Metric | Ratio |
|---|---|
| EPS-based Payout Ratio | 36.27 % |
| Free Cash Flow-based Payout Ratio | 59.87 % |
Norfolk Southern’s payout ratios, 36.27% (EPS) and 59.87% (FCF), highlight a prudent approach to dividend policy, allowing for retained earnings to support strategic initiatives.
💵 Cashflow & Capital Efficiency
Examining the efficiency of cash flow and capital returns reveals significant insights into operational stability and investment potential. Norfolk Southern exhibits strong capital allocation with regulations in place to support its strategic initiatives.
| Year | 2022 | 2023 | 2024 |
|---|---|---|---|
| Free Cash Flow Yield | 3.93 % | 1.55 % | 3.15 % |
| Earnings Yield | 5.65 % | 3.41 % | 4.94 % |
| CAPEX to Operating Cash Flow | 46.14 % | 73.89 % | 58.76 % |
| Stock-based Compensation to Revenue | 0.41 % | 0 % | 0 % |
| Free Cash Flow / Operating Cash Flow Ratio | 53.86 % | 26.11 % | 41.24 % |
Norfolk Southern demonstrates a well-managed approach to capital efficiency, with competitive free cash flow yields and reasonable capital expenditures supporting healthy operational execution.
📉 Balance Sheet & Leverage Analysis
Analyzing Norfolk Southern’s balance sheet metrics gives insight into its leverage and financial stability. Understanding these ratios helps in assessing risk and financial health.
| Year | 2022 | 2023 | 2024 |
|---|---|---|---|
| Debt-to-Equity | 1.22 | 1.37 | 1.22 |
| Debt-to-Assets | 0.40 | 0.42 | 0.4 |
| Debt-to-Capital | 0.55 | 0.58 | 0.55 |
| Net Debt to EBITDA | 2.50 | 3.69 | 2.89 |
| Current Ratio | 0.76 | 1.24 | 0.90 |
| Quick Ratio | 0.66 | 1.14 | 0.82 |
| Financial Leverage | 3.05 | 3.26 | 3.05 |
The balance sheet metrics show that Norfolk Southern maintains a moderate leverage level, balancing its debt commitments with robust equity to preserve liquidity and financial flexibility.
⚖️ Fundamental Strength & Profitability
Fundamentals highlight the underpinnings of Norfolk Southern’s profitability and operational effectiveness, focusing on returns and margins which are crucial indicators of financial success.
| Year | 2022 | 2023 | 2024 |
|---|---|---|---|
| Return on Equity | 25.68 % | 14.29 % | 18.33 % |
| Return on Assets | 8.41 % | 4.39 % | 6.00 % |
| Net Margin | 25.66 % | 15.03 % | 21.63 % |
| EBIT Margin | 37.83 % | 25.02 % | 34.12 % |
| EBITDA Margin | 47.41 % | 35.70 % | 45.28 % |
| Gross Margin | 37.14 % | 23.10 % | 31.05 % |
| R&D to Revenue | 0 % | 0 % | 0 % |
Norfolk Southern’s strong return metrics and healthy profit margins indicate proficient management and a robust competitive edge in its operational domain.
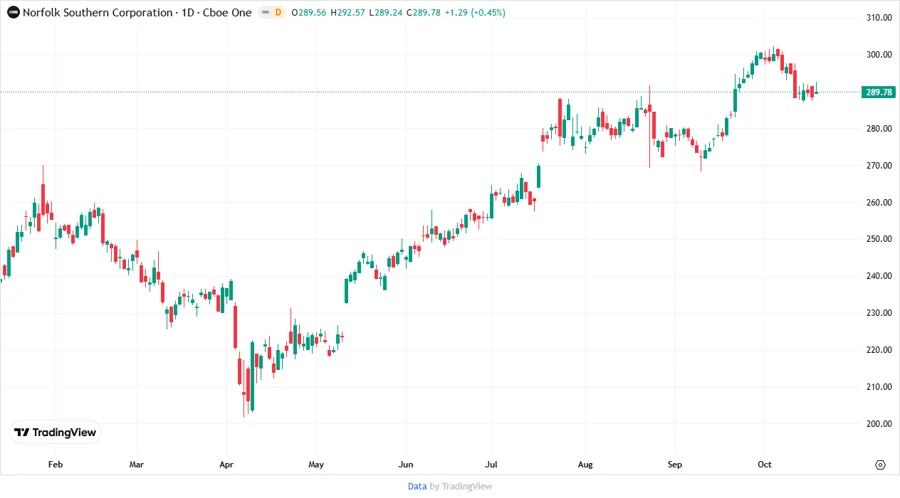
📈 Price Development
🔍 Dividend Scoring System
| Criteria | Score | Score Bar |
|---|---|---|
| Dividend Yield | 3 | |
| Dividend Stability | 5 | |
| Dividend Growth | 4 | |
| Payout Ratio | 4 | |
| Financial Stability | 4 | |
| Dividend Continuity | 5 | |
| Cashflow Coverage | 3 | |
| Balance Sheet Quality | 3 |
Overall Score: 31 / 40
✅ Rating
Taking into account Norfolk Southern’s long-standing dividend history, solid payout ratios, and robust financial standing, the company presents as a viable option for dividend-focused portfolios. Our assessment suggests that investors could consider a position in Norfolk Southern Corporation, primarily for its dependable returns and stable financial track record.
Smart Data Insight
Master the Perfect Entry & Exit for this Stock
Don't leave your profits to chance. Historically, this stock follows specific seasonal patterns that institutional traders use to maximize returns.
- ✅ Identify the "Golden Buying Window"
- ✅ Avoid high-risk correction cycles
- ✅ Backtested data from the last 20+ years