October 12, 2025 a 11:31 am
NSC: Dividend Analysis - Norfolk Southern Corporation
Norfolk Southern Corporation stands as a robust player in the transportation sector, delivering consistent dividend growth over the years. With a current dividend yield of 1.96%, it presents a moderate income opportunity in a stable industry. The company exhibits a remarkable 44-year history of uninterrupted dividends, reflecting its strong and reliable capital distribution policy.
📊 Overview
Norfolk Southern Corporation operates within the dynamic transportation sector, renowned for its resilient dividend policy. Here's a snapshot of the company's key dividend metrics:
| Metric | Value |
|---|---|
| Sector | Transport |
| Dividend Yield | 1.96 % |
| Current Dividend per Share | 5.40 USD |
| Dividend History | 44 years |
| Last Cut or Suspension | None |
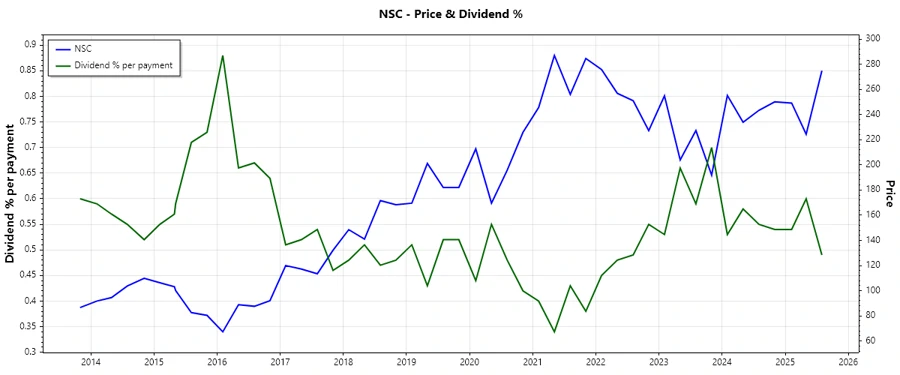
📈 Dividend History
With a dividend history spanning 44 years, Norfolk Southern Corporation showcases stability and a long-term commitment to shareholder returns. This track record enhances investor confidence, acting as a testament to its financial health.
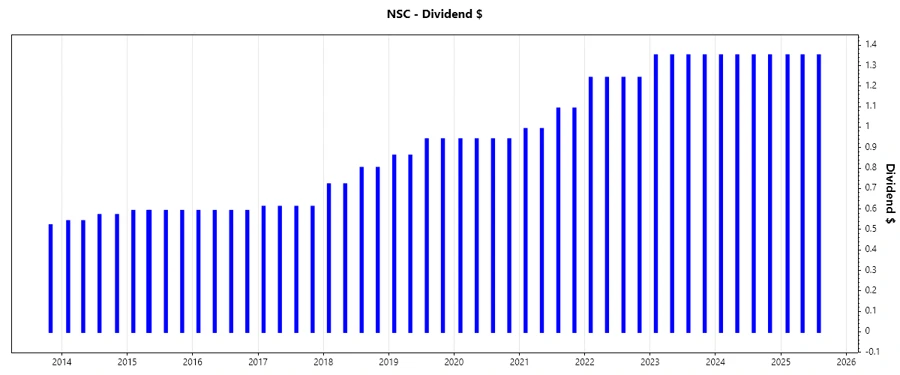
| Year | Dividend per Share (USD) |
|---|---|
| 2025 | 4.05 |
| 2024 | 5.40 |
| 2023 | 5.40 |
| 2022 | 4.96 |
| 2021 | 4.16 |
📈 Dividend Growth
The dividend growth rates over the past years highlight the company’s dedication to increasing shareholder value. Maintaining a gradual and sustainable growth rate is imperative for evaluating future income potential.
| Time | Growth |
|---|---|
| 3 years | 9.09 % |
| 5 years | 8.45 % |
The average dividend growth is 8.45% over 5 years. This demonstrates moderate but steady dividend growth, presenting a reliable income stream for investors.
💡 Payout Ratio
Payout ratios are key indicators of dividend sustainability. They provide insights into the company's ability to maintain its dividend payments relative to earnings and free cash flow.
| Key Figure | Ratio |
|---|---|
| EPS-based | 36.27% |
| Free cash flow-based | 59.87% |
With an EPS payout ratio of 36.27%, Norfolk Southern Corporation shows a safe margin, suggesting robust profitability and room for future dividend growth. The free cash flow payout ratio of 59.87% is slightly higher but within the acceptable range.
💧 Cashflow & Capital Efficiency
Analyzing cash flow alongside capital efficiency metrics is vital to ascertain the company's ability to generate sufficient cash to sustain operations, service debt, and distribute dividends.
| Metric | 2024 | 2023 | 2022 |
|---|---|---|---|
| Free Cash Flow Yield | 3.15% | 1.55% | 3.93% |
| Earnings Yield | 4.94% | 3.41% | 5.65% |
| CAPEX to Operating Cash Flow | 51.86% | 73.89% | 46.14% |
| Stock-based Compensation to Revenue | 0% | 0% | 0.42% |
| Free Cash Flow / Operating Cash Flow Ratio | 41.2% | 26.1% | 53.9% |
The steady FCF yield and operating efficiency ratios indicate Norfolk Southern Corporation’s consistent cash flow generation. CAPEX levels are maintained strategically to support future growth.
🏦 Balance Sheet & Leverage Analysis
Assessing the balance sheet and leverage provides insights into the company’s financial stability and its ability to manage debt responsibly.
| Metric | 2024 | 2023 | 2022 |
|---|---|---|---|
| Debt-to-Equity | 1.22 | 1.37 | 1.22 |
| Debt-to-Assets | 0.40 | 0.42 | 0.40 |
| Debt-to-Capital | 0.55 | 0.58 | 0.55 |
| Net Debt to EBITDA | 2.47 | 3.69 | 2.50 |
| Current Ratio | 0.79 | 1.24 | 0.76 |
| Quick Ratio | 0.82 | 1.14 | 0.66 |
The company maintains a balanced debt profile, with debt-to-equity ratios illustrating controlled use of leverage to finance its operations, offering flexibility for future financing needs.
💪 Fundamental Strength & Profitability
Strong profitability metrics are crucial, reflecting the company's ability to sustain competitive advantages and generate excess returns for shareholders.
| Metric | 2024 | 2023 | 2022 |
|---|---|---|---|
| Return on Equity | 18.33% | 14.29% | 25.68% |
| Return on Assets | 6.00% | 4.39% | 8.41% |
| Net Margin | 21.63% | 15.03% | 25.66% |
| EBIT Margin | 34.12% | 25.02% | 37.83% |
| EBITDA Margin | 45.28% | 35.70% | 47.41% |
| Gross Margin | 31.05% | 23.10% | 37.14% |
| Research & Development to Revenue | 0% | 0% | 0% |
Norfolk Southern Corporation exhibits strong fundamental strength with a commendable ROE and high profit margins, showcasing effective capital management and a robust competitive position.
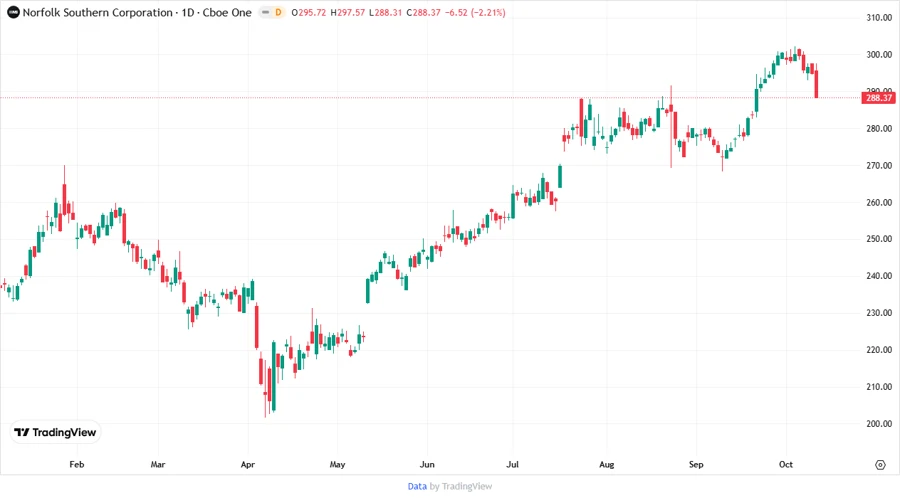
📉 Price Development
✅ Dividend Scoring System
| Category | Score | Bar |
|---|---|---|
| Dividend Yield | 3 | |
| Dividend Stability | 5 | |
| Dividend Growth | 4 | |
| Payout Ratio | 4 | |
| Financial Stability | 4 | |
| Dividend Continuity | 5 | |
| Cashflow Coverage | 3 | |
| Balance Sheet Quality | 4 |
Overall Score: 32/40
🗣️ Rating
Norfolk Southern Corporation receives a strong recommendation based on its robust dividend history, consistent growth rates, and solid financial foundation. While the current yield may not top the charts, the company is a reliable choice for those seeking stability and gradual income growth, making it a commendable investment in the transportation sector.
Smart Data Insight
Master the Perfect Entry & Exit for this Stock
Don't leave your profits to chance. Historically, this stock follows specific seasonal patterns that institutional traders use to maximize returns.
- ✅ Identify the "Golden Buying Window"
- ✅ Avoid high-risk correction cycles
- ✅ Backtested data from the last 20+ years