September 11, 2025 a 07:32 am


NSC: Dividend Analysis - Norfolk Southern Corporation
Norfolk Southern Corporation exhibits robust financial health, marked by a long-standing history of dividend payments spanning over 44 years. With a modest current dividend yield of 1.96%, the stability of its payouts can be attributed to its consistent dividend history. Such a firm standing in dividends makes it a potentially attractive proposition for income-focused investors, despite some variability in short-term growth metrics.
📊 Overview
Norfolk Southern Corporation operates within the Infrastructure sector, manifesting solid dividend metrics. With a current dividend per share of $5.40 and an impressive dividend payment history of 44 years, it offers a reassuring investment profile with no recent cuts or suspensions in dividends.
| Characteristic | Value |
|---|---|
| Sector | Infrastructure |
| Dividend yield | 1.96% |
| Current dividend per share | $5.40 |
| Dividend history | 44 years |
| Last cut or suspension | None |
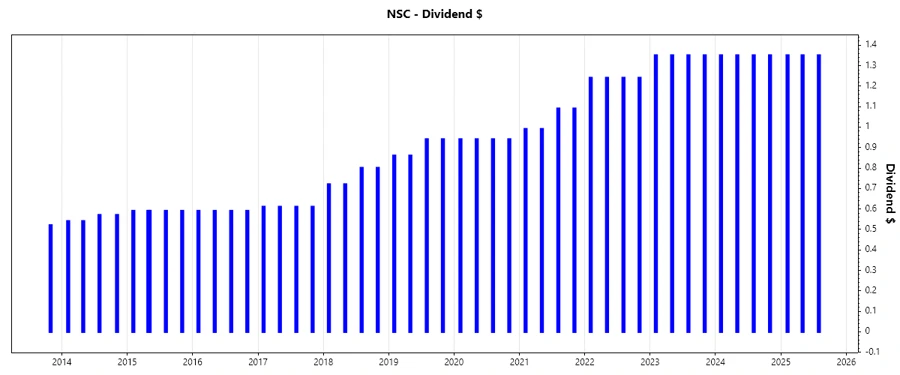
🗣️ Dividend History
Examining the dividend history of Norfolk Southern Corporation reveals resilience and consistency, especially important for assessing long-term investment viability in dividend-oriented portfolios.
| Year | Dividend per Share (USD) |
|---|---|
| 2025 | $4.05 |
| 2024 | $5.40 |
| 2023 | $5.40 |
| 2022 | $4.96 |
| 2021 | $4.16 |
📈 Dividend Growth
Understanding the growth trajectory of dividends is crucial for gauging future payout expectations. Norfolk Southern Corporation shows a measurable yet steady growth in dividends over the past years.
| Time | Growth |
|---|---|
| 3 years | 9.09% |
| 5 years | 8.45% |
The average dividend growth is 8.45% over 5 years. This shows moderate but steady dividend growth.
📉 Payout Ratio
Payout Ratios are critical in ascertaining the sustainability of dividends. Norfolk Southern Corporation exhibits a controlled payout landscape, with ratios reflecting its prudent financial strategy.
| Key figure | Ratio |
|---|---|
| EPS-based | 36.27% |
| Free cash flow-based | 59.86% |
A 36.27% EPS-based and 59.86% FCF-based payout ratio suggests room for growth in dividends while maintaining a solid buffer against earnings volatility.
✅ Cashflow & Capital Efficiency
Cash flow and capital efficiency metrics provide insight into the firm's operational efficiency and reinvestment capabilities, both critical for sustaining dividend payments.
| Metric | 2024 | 2023 | 2022 |
|---|---|---|---|
| Free Cash Flow Yield | 3.15% | 1.55% | 3.93% |
| Earnings Yield | 5.00% | 3.41% | 5.65% |
| CAPEX to Operating Cash Flow | 58.76% | 73.89% | 46.14% |
| Stock-based Compensation to Revenue | 0.00% | 0.00% | 0.42% |
| Free Cash Flow / Operating Cash Flow Ratio | 41.24% | 26.11% | 53.86% |
The data depicts a company with reasonable cash flow stability and a robust capital efficiency framework, favoring sustained dividend distributions over time.
⚠️ Balance Sheet & Leverage Analysis
Balance sheet metrics such as leverage and liquidity ratios determine the firm's long-term financial health and its capability to meet obligations, impacting its dividend policy.
| Metric | 2024 | 2023 | 2022 |
|---|---|---|---|
| Debt-to-Equity | 1.22 | 1.37 | 1.22 |
| Debt-to-Assets | 0.40 | 0.42 | 0.40 |
| Debt-to-Capital | 0.55 | 0.58 | 0.55 |
| Net Debt to EBITDA | 2.89 | 3.69 | 2.50 |
| Current Ratio | 0.90 | 1.24 | 0.76 |
| Quick Ratio | 0.82 | 1.14 | 0.66 |
| Financial Leverage | 3.05 | 3.26 | 3.05 |
Norfolk Southern Corporation maintains a consistent leverage profile, favoring financial agility while stabilizing its dividend policy amidst variable economic conditions.
📈 Fundamental Strength & Profitability
Profitability and fundamental strength offer insights into potential value creation for shareholders, contributing to the dividend-paying capacity of the enterprise.
| Metric | 2024 | 2023 | 2022 |
|---|---|---|---|
| Return on Equity | 18.33% | 14.29% | 25.68% |
| Return on Assets | 6.00% | 4.39% | 8.41% |
| Margins: Net | 21.63% | 15.03% | 25.66% |
| Margins: EBIT | 34.12% | 25.02% | 37.83% |
| Margins: EBITDA | 45.28% | 35.70% | 47.41% |
| Margins: Gross | 37.47% | 44.27% | 43.33% |
| Research & Development to Revenue | 0.00% | 0.00% | 0.00% |
Examining profitability metrics reveals that Norfolk Southern Corporation is capable of yielding substantial returns, thus supporting sustained and potentially increasing dividends.
📉 Price Development
✅ Dividend Scoring System
This scoring system evaluates specific dividend-related criteria, each rated on a scale from 1 to 5, with a total possible score of 40 points.
| Criteria | Score | Score Bar |
|---|---|---|
| Dividend yield | 3 | |
| Dividend Stability | 5 | |
| Dividend growth | 4 | |
| Payout ratio | 4 | |
| Financial stability | 4 | |
| Dividend continuity | 5 | |
| Cashflow Coverage | 3 | |
| Balance Sheet Quality | 4 |
Total Score: 32/40
📈 Rating
Norfolk Southern Corporation offers a competent dividend profile. With a steady history of payouts and tangible growth in dividends, it represents a viable candidate for dividend-seeking investors. While the dividend yield is relatively modest, the overall financial stability and profitability reinforce its standing as a reliable income investment.
Smart Data Insight
Master the Perfect Entry & Exit for this Stock
Don't leave your profits to chance. Historically, this stock follows specific seasonal patterns that institutional traders use to maximize returns.
- ✅ Identify the "Golden Buying Window"
- ✅ Avoid high-risk correction cycles
- ✅ Backtested data from the last 20+ years