June 10, 2026 a 02:03 pm

NRG: Trend and Support & Resistance Analysis - NRG Energy, Inc.
The recent performance of NRG Energy, Inc. shows volatility, with the stock experiencing fluctuations in the presence of broader market pressures and industry trends. As an energy company with a diverse portfolio, NRG's adaptability in shifting energy demands is notable. The analysis focuses on identifying current trends and key support and resistance zones, crucial for short-term trading. Investors should be aware of potential technical signals which might indicate future price movements.
Trend Analysis
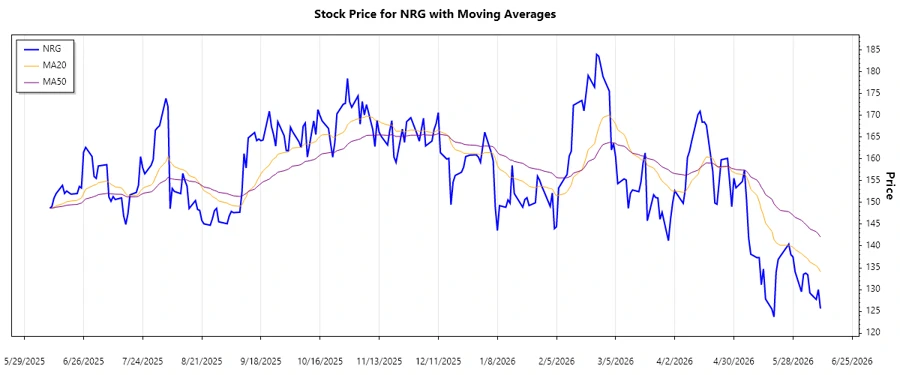
Analyzing recent price data for NRG, we computed 20-day and 50-day exponential moving averages (EMA) to gauge the trend direction. The results suggest a dominant downward movement.
| Date | Close Price | Trend |
|---|---|---|
| 2026-06-10 | 125.62 | ▼ Downtrend |
| 2026-06-09 | 129.96 | ▼ Downtrend |
| 2026-06-08 | 127.71 | ▼ Downtrend |
| 2026-06-05 | 129.20 | ▼ Downtrend |
| 2026-06-04 | 133.39 | ▼ Downtrend |
| 2026-06-03 | 133.76 | ▼ Downtrend |
| 2026-06-02 | 133.51 | ▼ Downtrend |
The calculation suggests a persistent downtrend as the 20-day EMA remains below the 50-day EMA consistently, signaling continuation of bearish sentiment.
Support- and Resistance
Key support and resistance levels are critical for determining potential price reversals or breakouts. Based on historical data, the following levels have been identified:
| Zone Type | From | To |
|---|---|---|
| Support 1 | 124.50 | 126.00 |
| Support 2 | 128.00 | 129.00 |
| Resistance 1 | 134.00 | 136.00 |
| Resistance 2 | 139.00 | 141.00 |
Currently, NRG's stock price is hovering near the second support zone, signaling potential for a rebound or further decline depending on overall market conditions.
Conclusion
The current analysis underlines a bearish trend driven by technical indicators but suggests potential for future appreciation if the current support holds. Investors should be cautious, considering broader market influences and internal industry dynamics. While the current trend hints at risks, opportunities may arise for those positioned to capitalize on potential reversals or market corrections.
Smart Data Insight
Master the Perfect Entry & Exit for this Stock
Don't leave your profits to chance. Historically, this stock follows specific seasonal patterns that institutional traders use to maximize returns.
- ✅ Identify the "Golden Buying Window"
- ✅ Avoid high-risk correction cycles
- ✅ Backtested data from the last 20+ years