September 28, 2025 a 01:15 pm
NRG: Trend and Support & Resistance Analysis - NRG Energy, Inc.
The recent analysis of NRG Energy, Inc. shows a notable recovery in its stock price following a period of significant decline earlier in the year. With diverse energy production capabilities and a broad customer base, NRG demonstrates resilience in a volatile market. However, potential challenges remain, including fluctuations in energy demand and competitive pressures, which may impact future performance.
Trend Analysis
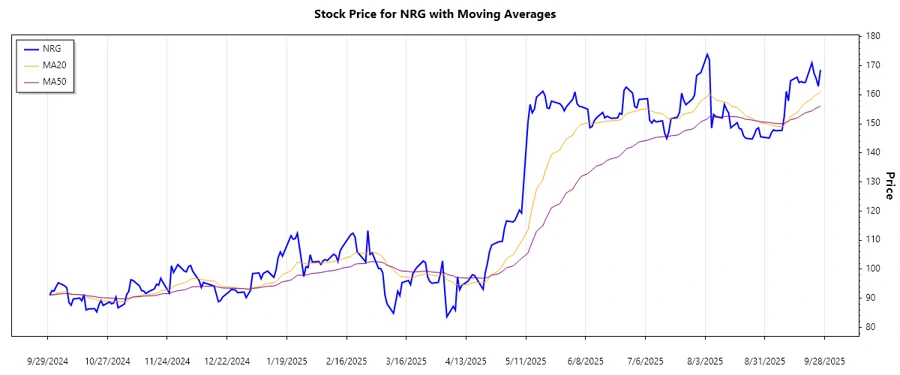
The daily closing price data for NRG indicates a recovering trajectory post-June 2025 after a prolonged decline starting in March 2025. Using the EMA20 and EMA50, a distinct trend can be identified:
| Date | Closing Price | Trend |
|---|---|---|
| 2025-09-26 | $168.57 | ▲ Uptrend |
| 2025-09-25 | $162.96 | ▼ Downtrend |
| 2025-09-24 | $165.58 | ▲ Uptrend |
| 2025-09-23 | $167.43 | ▲ Uptrend |
| 2025-09-22 | $170.97 | ▲ Uptrend |
| 2025-09-19 | $164.36 | ▼ Downtrend |
| 2025-09-18 | $164.19 | ▼ Downtrend |
Based on EMA indicators, NRG shows primarily an upward trend, indicating potential for continued growth.
Support and Resistance
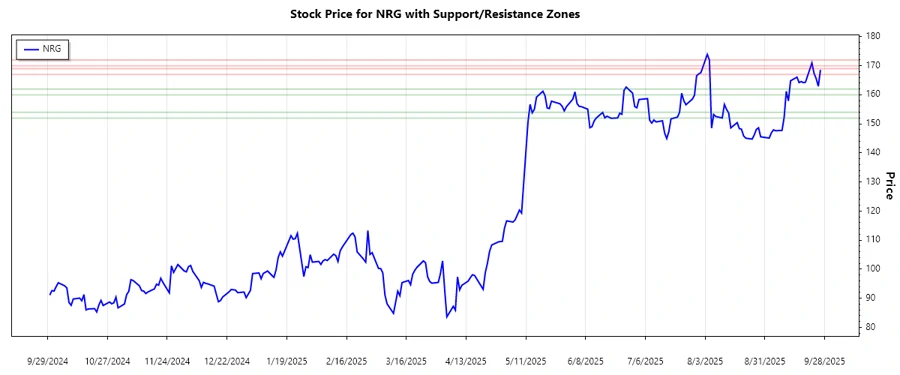
Identified support and resistance levels based on historical closing prices suggest key decision points for market participants:
| Zone Type | From | To |
|---|---|---|
| Resistance | $170 | $172 |
| Resistance | $167 | $169 |
| Support | $160 | $162 |
| Support | $152 | $154 |
The current price near $168 sits within the higher resistance zone, suggesting a potential pause in upward momentum.
Conclusion
NRG Energy, Inc.'s stock has shown resilience with a transitional phase from a downturn to a more positive directional trend. The company's diversification across multiple energy sectors provides optimism amidst economic fluctuations. However, current resistance levels present potential challenges. Analysts should monitor external market factors and company-specific developments closely, considering both potential growth opportunities as well as inherent risks.
JSON Representation: