
July 14, 2026 a 04:44 pm
NRG: Fibonacci Analysis - NRG Energy, Inc.
NRG Energy, Inc. operates as a diversified power utility across the United States, catering to millions with its wide array of energy solutions. The stock has seen significant movements over the past months, reflecting the dynamic nature of its business operations and market presence. Technical analysis indicates critical insights for potential investors and traders. The recent trend showcases salient opportunities amidst the evolving energy sector.
Fibonacci Analysis
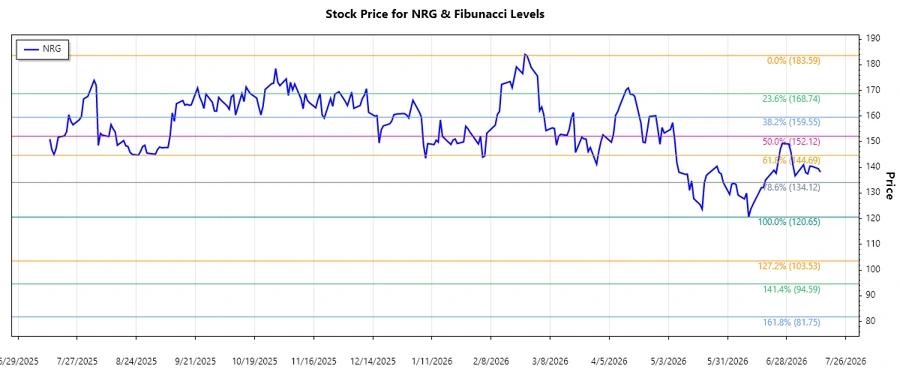
Based on the data provided, NRG Energy's recent trend exhibits an evident downward momentum, peaking at $183.59 on February 25, 2026, and reaching the lowest at $120.65 on June 10, 2026.
| Start Date | End Date | High Price | High Date | Low Price | Low Date |
|---|---|---|---|---|---|
| 2026-02-25 | 2026-06-10 | 183.59 | 2026-02-25 | 120.65 | 2026-06-10 |
| Fibonacci Level | Price Level |
|---|---|
| 0.236 | 137.28 |
| 0.382 | 146.17 |
| 0.5 | 152.12 |
| 0.618 | 158.06 |
| 0.786 | 167.62 |
The current price stands around $138.18, indicating a position within the 0.236 Fibonacci retracement zone. This suggests a potential support area where the price might stabilize before determining its next direction.
Technically, the identified price levels serve as key support/resistance points, aiding in predicting future price movements and aiding strategic decisions.
Stock chart illustrating NRG Energy's recent price trend and Fibonacci retracement levels over the analyzed period.
Conclusion
NRG Energy, Inc., while enduring recent downward pressures, may find stabilization around current price levels due to identified support zones. The company's diverse energy sector involvement continues to present both volatility and opportunities. While investors should remain cautious of further declines, the potential for rebounds presents strategic entry points. Continuous monitoring of the energy sector's regulatory and technological progression is essential in evaluating NRG's future prospects.
Smart Data Insight
Master the Perfect Entry & Exit for this Stock
Don't leave your profits to chance. Historically, this stock follows specific seasonal patterns that institutional traders use to maximize returns.
- ✅ Identify the "Golden Buying Window"
- ✅ Avoid high-risk correction cycles
- ✅ Backtested data from the last 20+ years