May 18, 2026 a 11:44 am

NRG: Fibonacci Analysis - NRG Energy, Inc.
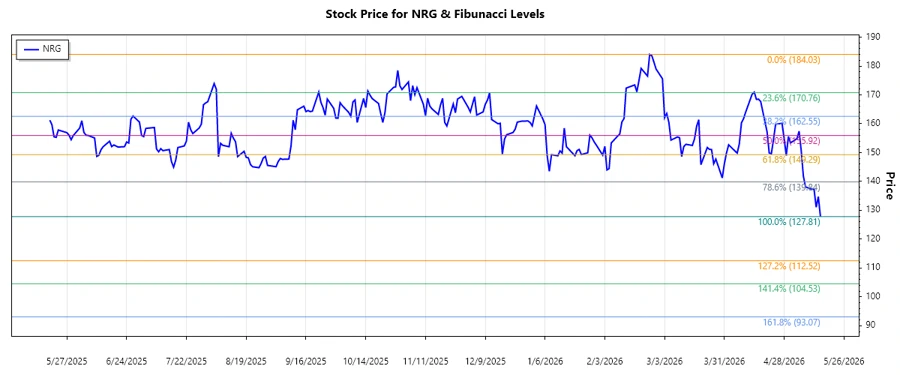
NRG Energy, Inc. is a versatile power company in the U.S., with its business spanning across power generation from multiple sources and retail energy services. Recent analysis shows a dominant downtrend, suggesting cautiousness for potential investors. The recent price movements could impact various strategic decisions for stakeholders.
Fibonacci Analysis
| Parameter | Details |
|---|---|
| Start Date | 2026-02-24 |
| End Date | 2026-05-15 |
| High Point (Price & Date) | $184.03 (2026-02-24) |
| Low Point (Price & Date) | $127.81 (2026-05-15) |
Fibonacci Levels
| Level | Price |
|---|---|
| 0.236 | $141.14 |
| 0.382 | $148.26 |
| 0.5 | $155.92 |
| 0.618 | $163.58 |
| 0.786 | $172.75 |
The current price of $127.81 is below the 0.236 retracement level, outside typical retracement zones, indicating potential further decline or stabilization at a new low. This indicates additional technical support may be at play or the need for new investor confidence to trigger a reversal.
Conclusion
NRG Energy, Inc.'s recent bearish trend raises concerns for short-term investors but presents an opportunity for others to assess long-term strategic investments. The technical indicators suggest stabilization is needed to reverse the downtrend. Investors should monitor any developments that could enhance company performance or market sentiment.
Smart Data Insight
Master the Perfect Entry & Exit for this Stock
Don't leave your profits to chance. Historically, this stock follows specific seasonal patterns that institutional traders use to maximize returns.
- ✅ Identify the "Golden Buying Window"
- ✅ Avoid high-risk correction cycles
- ✅ Backtested data from the last 20+ years