November 03, 2025 a 03:15 pm
NRG: Fibonacci Analysis - NRG Energy, Inc.
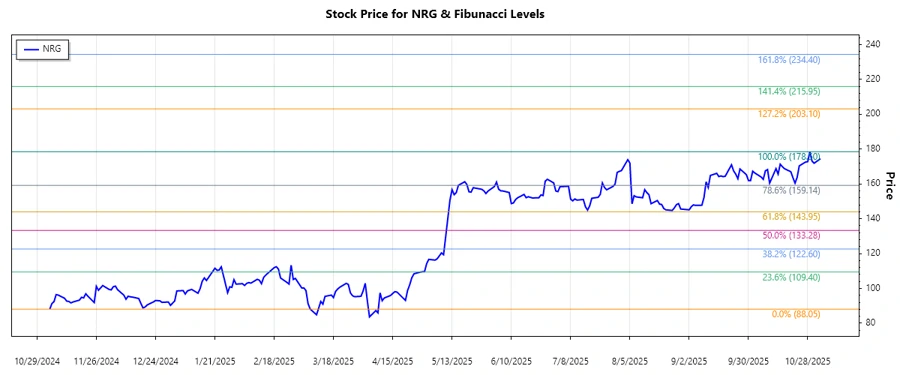
NRG Energy, Inc. has shown a significant upward trend in recent months, which reflects market optimism about its operations in integrated power services across the United States. The company's diversified energy portfolio and strategic initiatives have fostered investor confidence. Current technical analyses suggest key levels to watch, and Fibonacci analysis offers insight into future price behavior.
Fibonacci Analysis
| Trend Start Date | Trend End Date | Highest Price & Date | Lowest Price & Date | Fibonacci Levels | Current Price | Retracement Zone | Technical Interpretation |
|---|---|---|---|---|---|---|---|
| 2024-11-04 | 2025-11-03 | 178.50 (2025-10-29) | 88.05 (2024-11-04) |
|
174.46 | None | The stock's current positioning above the highest Fibonacci level suggests strong upward momentum without signs of reversal. |
Conclusion
NRG Energy, Inc. has exhibited a robust bullish trend over the past year. This is supported by a diversified energy portfolio and strategic maneuvers within the energy sector. However, as with any stock, there are inherent risks related to market fluctuations and regulatory challenges. For investors, the technical analysis, bolstered by Fibonacci retracement levels, highlights the absence of significant resistance at current levels, pointing to continued growth potential. Nonetheless, it is crucial to monitor the stock price closely for any deviations from this upward trend.
Smart Data Insight
Master the Perfect Entry & Exit for this Stock
Don't leave your profits to chance. Historically, this stock follows specific seasonal patterns that institutional traders use to maximize returns.
- ✅ Identify the "Golden Buying Window"
- ✅ Avoid high-risk correction cycles
- ✅ Backtested data from the last 20+ years