July 19, 2025 a 11:45 am

NRG: Fibonacci Analysis - NRG Energy, Inc.
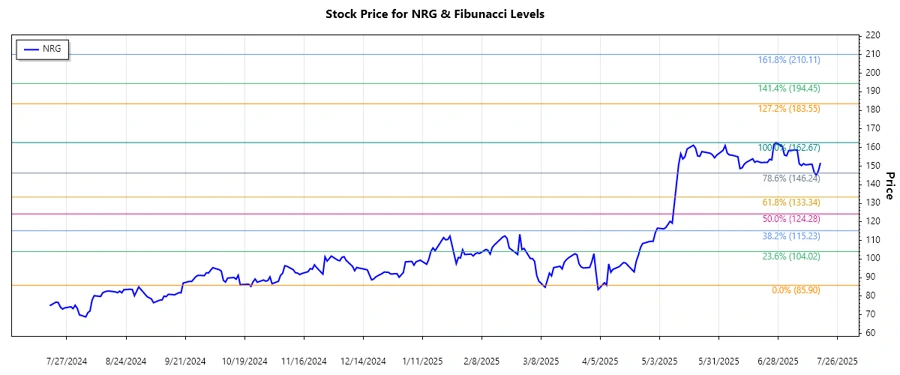
The analysis of NRG Energy, Inc. indicates a strong uptrend from late March 2025 to mid-July 2025. The market sentiment remains optimistic. However, factors such as the overall industry performance and energy market fluctuations could cause some volatility. Investors should be cautious of potential market corrections.
Fibonacci Analysis
| Item | Details |
|---|---|
| Trend Duration | 2025-03-13 to 2025-07-18 |
| High Point | $162.67 on 2025-06-27 |
| Low Point | $85.9 on 2025-04-08 |
| Fibonacci Levels |
|
| Current Price | $151.75 on 2025-07-18 |
| Retracement Zone | Between 0.5 and 0.618 |
| Interpretation | The current price nestles between the 0.5 and 0.618 Fibonacci retracement levels, signaling potential support. This may indicate a continuation of the uptrend if the support remains intact. |
Conclusion
NRG Energy, Inc. is seeing a robust upward momentum, which is supported by the Fibonacci level analysis. This moves into established retracement zones, highlighting potential support levels. However, the energy sector can be volatile, and external market factors remain a concern. Investors should watch for any break below the 0.618 level, which could indicate weakness. Analysts find this stock appealing for short-term momentum plays with cautious optimism, given the strong support levels indicated by the retracement analysis.