
June 28, 2026 a 03:30 pm
NRG: Dividend Analysis - NRG Energy, Inc.
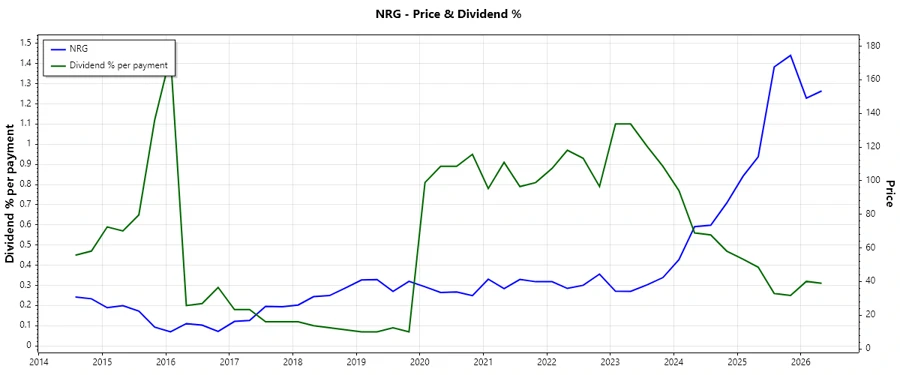
NRG Energy, Inc. has shown a steady dividend history over the past 15 years with a moderate yield of approximately 1.19%. The dividend payments have been consistent, demonstrating stability and commitment to shareholders. However, the payout ratios suggest caution as the sustainability of current dividends amidst financial performance needs careful evaluation.
📊 Overview
Understanding the company's sector and its key dividend metrics aids in comprehensive investment analysis. The company's characteristics such as its dividend yield and historical dividend performance provide critical insights.
| Metric | Details |
|---|---|
| Sector | Utilities |
| Dividend Yield | 1.19% |
| Current Dividend per Share | 2.11 USD |
| Dividend History | 15 years |
| Last Cut or Suspension | None |
🗣️ Dividend History
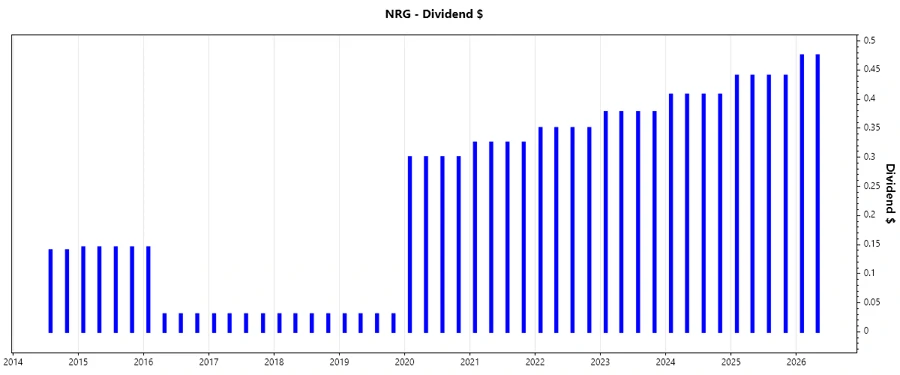
Examining past dividend payments is essential to gauge the company's commitment to returning profits to shareholders. NRG Energy's 15-year dividend history exemplifies consistent returns, indicating investor treatment as a priority.
| Year | Dividend per Share (USD) |
|---|---|
| 2026 | 0.95 |
| 2025 | 1.76 |
| 2024 | 1.63 |
| 2023 | 1.51 |
| 2022 | 1.40 |
📈 Dividend Growth
Dividend growth reflects a company's earnings growth potential and financial health. A closer look at 3- and 5-year growth provides insights into incremental improvements.
| Time | Growth |
|---|---|
| 3 years | 7.93% |
| 5 years | 7.96% |
The average dividend growth is 7.96% over 5 years. This shows moderate but steady dividend growth.
📉 Payout Ratio
Payout ratios measure the proportion of earnings or cash flow paid out as dividends. High ratios may imply risk to dividends if earnings fall.
| Key Figure | Ratio |
|---|---|
| EPS-based | 182.55% |
| Free Cash Flow-based | -124.22% |
The EPS-based payout ratio is 182.55%, suggesting dividends exceed earnings, posing sustainability concerns. The negative FCF-based ratio indicates cash flow issues relative to dividend payments.
✅ Cashflow & Capital Efficiency
Evaluating cash flow metrics and capital efficiency helps assess the company's operational effectiveness and ability to sustain dividends.
| Year | 2025 | 2024 | 2023 |
|---|---|---|---|
| Free Cash Flow Yield | 2.47% | 9.87% | -6.95% |
| Earnings Yield | 2.78% | 6.05% | -1.71% |
| CAPEX to Operating Cash Flow | 59.96% | 20.47% | -270.59% |
| Stock-based Compensation to Revenue | 0.44% | 0.36% | 0.35% |
| Free Cash Flow / Operating Cash Flow Ratio | 40.04% | 79.53% | -370.59% |
NRG's cash flow and capital efficiency show volatility, with negative cash flow figures potentially impacting dividend sustainability.
⚠️ Balance Sheet & Leverage Analysis
Balance sheet analysis indicates financial stability, debt management, and liquidity, crucial for assessing risk.
| Year | 2025 | 2024 | 2023 |
|---|---|---|---|
| Debt-to-Equity | 997.38% | 443.54% | 377.53% |
| Debt-to-Assets | 57.54% | 45.75% | 42.13% |
| Debt-to-Capital | 90.89% | 81.60% | 79.06% |
| Net Debt to EBITDA | 3.16 | 2.86 | 5.96 |
| Current Ratio | - | 1.02 | 1.02 |
| Quick Ratio | 1.58 | 0.96 | 0.96 |
| Financial Leverage | 17.33 | 9.69 | 8.96 |
NRG's leverage ratios indicate a high level of debt, posing financial risk but could suggest leveraged growth opportunities if managed efficiently.
Profitability & Fundamental Strength
Examining profitability metrics ensures the company’s ability to generate earnings and maintain dividend payouts.
| Year | 2025 | 2024 | 2023 |
|---|---|---|---|
| Return on Equity | 51.40% | 45.40% | -6.95% |
| Return on Assets | 2.96% | 4.68% | -0.78% |
| Net Margin | 2.81% | 3.99% | -0.70% |
| EBIT Margin | 6.02% | 7.46% | 1.58% |
| EBITDA Margin | 12.39% | 12.45% | 6.07% |
| Gross Margin | 21.85% | 21.44% | 7.97% |
| R&D to Revenue | 0% | 0% | 0% |
NRG maintains respectable margins and profitability ratios, supporting its ability to manage and secure dividend payouts. However, profitability must continue to recover for sustainability.
Price Development
🟩 Dividend Scoring System
| Criteria | Score | Score Bar |
|---|---|---|
| Dividend Yield | 2 | |
| Dividend Stability | 4 | |
| Dividend Growth | 3 | |
| Payout Ratio | 1 | |
| Financial Stability | 2 | |
| Dividend Continuity | 4 | |
| Cashflow Coverage | 2 | |
| Balance Sheet Quality | 3 |
Total Score: 21/40
🗣️ Rating
NRG Energy, Inc. presents a mixed picture with consistent dividend payments but financial metrics that suggest potential volatility. The company's efforts to maintain dividends amidst challenging financial conditions define its shareholder commitment. Investors might view NRG as a moderately risky dividend stock, warranting cautious optimism with focus on sustainability improvements.
Smart Data Insight
Master the Perfect Entry & Exit for this Stock
Don't leave your profits to chance. Historically, this stock follows specific seasonal patterns that institutional traders use to maximize returns.
- ✅ Identify the "Golden Buying Window"
- ✅ Avoid high-risk correction cycles
- ✅ Backtested data from the last 20+ years