February 03, 2026 a 11:32 am

NRG: Dividend Analysis - NRG Energy, Inc.
NRG Energy, Inc., a significant player in the energy sector, showcases a nuanced dividend profile characterized by a stable history and moderate growth expectations. The company's responsible payout ratios suggest a balanced approach to reward shareholders while retaining sufficient operational flexibility. An examination of core financial metrics reveals a robust capital efficiency strategy, underpinned by prudent leverage management, although occasional profitability fluctuations warrant monitoring. Investors may find the company's dividend offers moderate yield potential, suitable for those prioritizing long-term stability over high immediate returns.
📊 Overview
| Metric | Value |
|---|---|
| Sector | Energy |
| Dividend yield | 1.20 % |
| Current dividend per share | 1.97 USD |
| Dividend history | 15 years |
| Last cut or suspension | None |
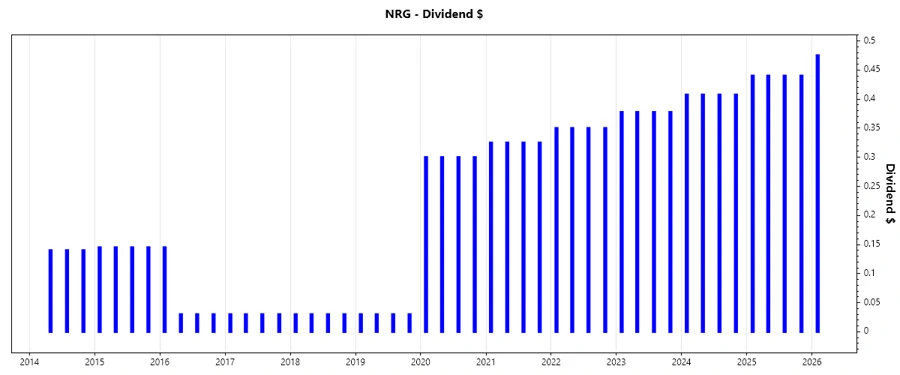
📈 Dividend History
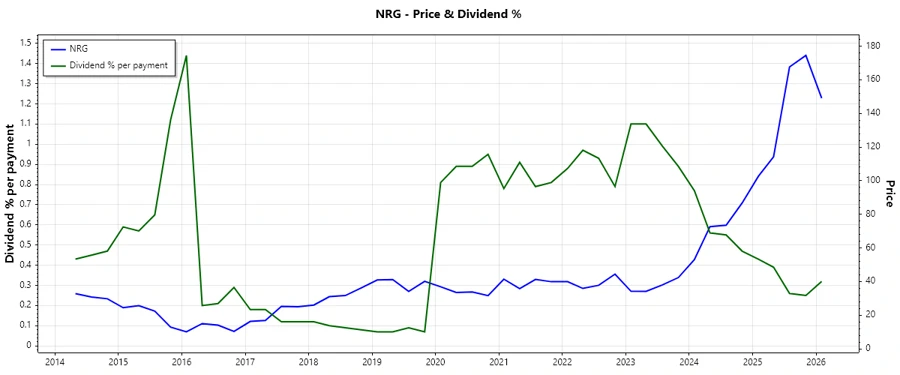
The dividend history of NRG Energy, Inc. reveals a consistent payout structure, spanning over 15 years without any recorded cuts or suspensions. This track record underscores management's commitment to steady shareholder returns, which can be especially reassuring in volatile market conditions. Such consistency is a hallmark of investor confidence and fiscal prudence, providing a dependable revenue stream that entices income-focused investors.
| Year | Dividend Per Share (USD) |
|---|---|
| 2026 | 0.475 |
| 2025 | 1.76 |
| 2024 | 1.63 |
| 2023 | 1.51 |
| 2022 | 1.40 |
📈 Dividend Growth
An analysis of the dividend growth reveals a moderate trajectory, marked by an average increase of approximately 7.96% over the past five years. This growth pattern, while not exceptionally aggressive, signals a steady augment in shareholder value, rooted in the company's sustainable profit generation capabilities. Such growth rates, particularly when consistently above inflation, can significantly enhance the real income of long-term investors.
| Time | Growth |
|---|---|
| 3 years | 7.93 % |
| 5 years | 7.96 % |
The average dividend growth is 7.96% over 5 years. This shows moderate but steady dividend growth.
🗣️ Payout Ratio
Payout ratios are critical indicators of the sustainability of a company's dividend payouts. With an EPS-based payout ratio of 26.33% and an FCF-based ratio of 22.07%, NRG Energy, Inc. appears to maintain a conservative dividend strategy. Such healthy ratios suggest substantial room for future payout enhancements, supporting reinvestment opportunities while safeguarding against potential earnings volatility.
| Key figure | Ratio |
|---|---|
| EPS-based | 26.33 % |
| Free cash flow-based | 22.07 % |
These ratios suggest a disciplined approach to shareholder returns, indicating a sustainable dividend policy with potential for prudent future increases.
📊 Cashflow & Capital Efficiency
In assessing NRG Energy's cash flow and capital efficiency, we observe effective cash generation juxtaposed with deliberate capital allocations. Metrics such as the Free Cash Flow Yield (5.97%) and the Earnings Yield (5.01%) reflect robust earning potential alongside efficient capital usage. The CAPEX to Operating Cash Flow ratio at 37.75% denotes focused investment in operational enhancements. Consistent Free Cash Flow/Operating Cash Flow ratios highlight the company's agility in cash flow management, pivotal for sustaining dividend payments and seizing growth opportunities.
| Metric | 2024 | 2023 | 2022 |
|---|---|---|---|
| Free Cash Flow Yield | 9.87 % | -6.95 % | -0.09 % |
| Earnings Yield | 6.05 % | -1.71 % | 16.26 % |
| CAPEX to Operating Cash Flow | 20.47 % | -270.59 % | 101.94 % |
| Stock-based Compensation to Revenue | 0.0036 % | 0.0035 % | 0.0009 % |
| Free Cash Flow / Operating Cash Flow Ratio | 79.53 % | 370.59 % | -1.94 % |
While generally positive, the fluctuation in cash flows requires continuous monitoring, particularly during capital-intensive phases, to ensure uninterrupted dividend payments and capitalize on emerging market opportunities.
📊 Balance Sheet & Leverage Analysis
NRG Energy's balance sheet strength and leverage metrics provide insights into its financial robustness and risk profile. The Debt-to-Equity ratio of 4.43 and a Net Debt to EBITDA ratio of 2.99 in 2024 indicate a reliance on leverage, which is mitigated through effective debt management reflected in stable coverage ratios. The current ratio remaining above 1.0 ensures sufficient liquidity to meet short-term obligations, although the leverage levels suggest a degree of caution regarding potential market downturns.
| Metric | 2024 | 2023 | 2022 |
|---|---|---|---|
| Debt-to-Equity | 4.43 | 3.78 | 2.17 |
| Debt-to-Assets | 45.75 % | 42.13 % | 28.48 % |
| Debt-to-Capital | 81.60 % | 79.06 % | 68.44 % |
| Net Debt to EBITDA | 2.99 | 5.96 | 2.81 |
| Current Ratio | 1.05 | 1.02 | 1.25 |
| Quick Ratio | 0.96 | 0.96 | 1.19 |
| Financial Leverage | 9.69 | 8.96 | 7.61 |
Overall, NRG Energy's financial stability is fortified by its capacity to service its debts, with careful leverage usage hinting at continued growth potential without compromising fiscal health.
📉 Fundamental Strength & Profitability
Fundamental and profitability metrics reflect NRG Energy's operational efficiency and earning power. Return on Equity (ROE) and Return on Assets (ROA) consistently illustrate its ability to generate profits from shareholder investments and asset utilization. The margins reveal profitable core operations, enhanced by prudent cost management and revenue-generating activities.
| Metric | 2024 | 2023 | 2022 |
|---|---|---|---|
| Return on Equity | 45.40% | -6.95% | 31.90% |
| Return on Assets | 4.68% | -0.78% | 4.19% |
| Net Profit Margin | 3.99% | -0.70% | 3.87% |
| EBIT Margin | 7.46% | 1.58% | 6.59% |
| EBITDA Margin | 12.44% | 6.07% | 8.88% |
| Gross Margin | 21.44% | 7.97% | 12.99% |
| R&D to Revenue | 0.00% | 0.00% | 0.00% |
These metrics affirm the company's solid profitability stance, albeit with some variability in recent years, highlighting the potential for sustained income generation and supported by strategic cost containment and revenue diversification practices.
📈 Price Development
✅ Dividend Scoring System
| Criterion | Score | Score Bar |
|---|---|---|
| Dividend Yield | 3 | |
| Dividend Stability | 5 | |
| Dividend Growth | 4 | |
| Payout Ratio | 5 | |
| Financial Stability | 4 | |
| Dividend Continuity | 5 | |
| Cashflow Coverage | 3 | |
| Balance Sheet Quality | 4 |
Overall Score: 33/40
⚠️ Rating
NRG Energy, Inc. offers a compelling dividend opportunity with a well-maintained payout history, modest yet stable growth, and sound financial foundations. While occasional profitability variances require vigilance, its comprehensive financial health and strategic management fortify long-term investor returns. The company's overall financial and dividend stability, reinforced by resilient cash flows and prudent leverage, support a favorable investment consideration for balanced portfolios.