January 09, 2026 a 11:31 am

NRG: Dividend Analysis - NRG Energy, Inc.
NRG Energy, Inc. (NRG) showcases a compelling dividend profile with a moderate yield and stable dividend history. The company's ability to grow dividends amidst industry volatility demonstrates strong management and efficient capital allocation. With 14 years of dividend history and a last suspension in 2017, NRG is poised as a reliable choice for dividend investors seeking growth and stability. Despite some debt concerns, its capacity to cover dividends through free cash flow provides confidence.
📊 Overview
NRG Energy, Inc. operates in the Utilities sector, offering a dividend yield of 1.01% with its current dividend per share standing at $1.97. Over the past 14 years, NRG has maintained a solid dividend history. The last cut or suspension occurred in 2017, reflecting cautious financial management in challenging periods.
| Key Metrics | Details |
|---|---|
| Sector | Utilities |
| Dividend Yield | 1.01% |
| Current Dividend per Share | $1.97 USD |
| Dividend History | 14 years |
| Last Cut or Suspension | 2017 |
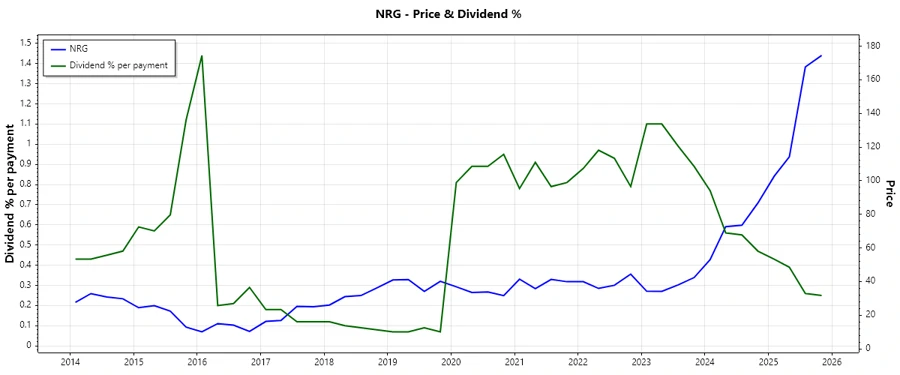
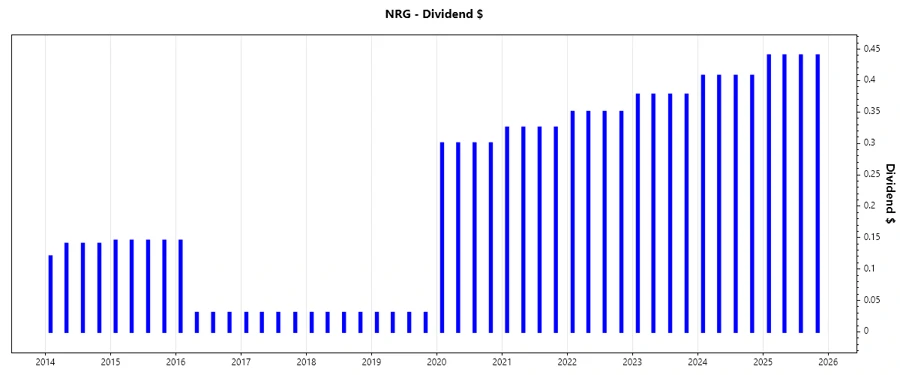
📈 Dividend History
The consistent dividend payments over the past years illustrate NRG's commitment to returning capital to shareholders. Such stability is crucial for those relying on dividend income, offering predictability in investment returns, despite facing industry challenges.
| Year | Dividend per Share (USD) |
|---|---|
| 2025 | 1.76 |
| 2024 | 1.63 |
| 2023 | 1.51 |
| 2022 | 1.40 |
| 2021 | 1.30 |
📈 Dividend Growth
Evaluating the dividend growth rate, NRG reports a 3-year growth rate of 7.93% and a 5-year growth rate of 7.96%. Such incremental growth reflects the company's ability to expand shareholder returns while navigating market dynamics. This growth enhances returns for patient investors who prioritize capital appreciation.
| Time | Growth |
|---|---|
| 3 years | 7.93% |
| 5 years | 7.96% |
The average dividend growth is 7.96% over 5 years. This illustrates moderate but steady dividend growth.
📉 Payout Ratio
NRG's payout ratios are pivotal indicators of its dividend sustainability. The EPS-based payout ratio at 26.33% and FCF-based payout ratio at 22.07% highlight prudent dividend distributions, leaving room for reinvestment in business operations.
| Key Figure | Ratio |
|---|---|
| EPS-based | 26.33% |
| Free cash flow-based | 22.07% |
These payouts signify a healthy dividend policy where NRG efficiently balances rewarding shareholders and maintaining growth capital.
📊 Cashflow & Capital Efficiency
Analyzing NRG's cash flow metrics reveals insights into its operational efficiency and financial health. These transparent indicators spotlight the company's ability to cover obligations and invest in future growth.
| Metric | 2024 | 2023 | 2022 |
|---|---|---|---|
| Free Cash Flow Yield | 9.87% | -6.95% | -0.09% |
| Earnings Yield | 6.05% | -1.71% | 16.26% |
| CAPEX to Operating Cash Flow | 20.47% | -270.59% | 101.94% |
| Stock-based Compensation to Revenue | 0.36% | 0.35% | 0.09% |
| Free Cash Flow / Operating Cash Flow Ratio | 79.53% | 370.59% | -1.94% |
The fluctuations in FCF and earnings yield relate directly to market dynamics, where efficiency in capital deployment remains key for sustained financial performance.
🏦 Balance Sheet & Leverage Analysis
NRG's leverage figures provide perspective on its debt strategy and solvency. Monitoring these metrics affords clarity on the company’s ability to manage liabilities and finance growth. Over the years, there has been visible improvement, indicating responsible financial stewardship.
| Metric | 2024 | 2023 | 2022 |
|---|---|---|---|
| Debt-to-Equity | 4.44 | 3.78 | 2.17 |
| Debt-to-Assets | 45.75% | 42.13% | 28.48% |
| Debt-to-Capital | 81.60% | 79.06% | 68.44% |
| Net Debt to EBITDA | 2.86 | 5.96 | 2.81 |
| Current Ratio | 1.02 | 1.02 | 1.25 |
| Quick Ratio | 0.96 | 0.96 | 1.19 |
| Financial Leverage | 9.69 | 8.96 | 7.61 |
Given the heightened leverage, there's a focus on the balance between debt cost and growth investments to maintain financial agility.
📈 Fundamental Strength & Profitability
Examining NRG's profitability and fundamental strength reveals its operational competencies and capacity to generate shareholder value. These data reflect core efficiencies that strengthen NRG's market stance and investor appeal.
| Metric | 2024 | 2023 | 2022 |
|---|---|---|---|
| Return on Equity | 45.40% | -6.95% | 31.90% |
| Return on Assets | 4.68% | -0.78% | 4.19% |
| Net Margin | 4.00% | -0.70% | 3.87% |
| EBIT Margin | 7.46% | 1.58% | 6.59% |
| EBITDA Margin | 12.45% | 6.07% | 8.88% |
| Gross Margin | 21.44% | 7.97% | 12.98% |
| R&D to Revenue | 0% | 0% | 0% |
The substantial ROE indicates effective utilization of shareholder capital, while varying margins and low R&D alignment suggest room for innovation-led profitability enhancement.
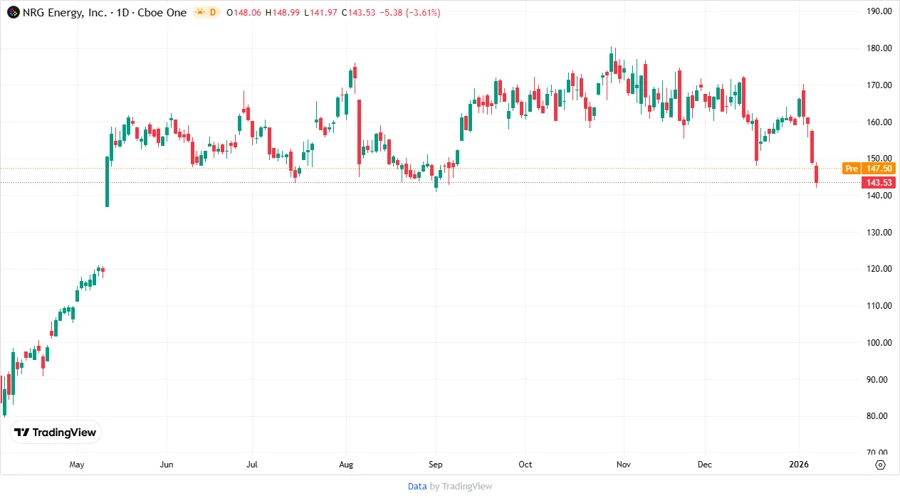
🚀 Price Development
📊 Dividend Scoring System
| Criteria | Score | Score Bar |
|---|---|---|
| Dividend Yield | 3 | |
| Dividend Stability | 4 | |
| Dividend Growth | 4 | |
| Payout Ratio | 5 | |
| Financial Stability | 3 | |
| Dividend Continuity | 4 | |
| Cashflow Coverage | 3 | |
| Balance Sheet Quality | 3 |
Overall Score: 29/40
✅ Rating
NRG Energy, Inc. offers a balanced dividend profile suitable for growth-oriented investors desiring moderate yield with potential for steady dividend growth. With careful risk assessment around leverage, its dividends are well-supported, making NRG a strong candidate for income-focused portfolios.