September 25, 2025 a 03:32 am
NRG: Dividend Analysis - NRG Energy, Inc.
NRG Energy, Inc. demonstrates a mixed dividend profile characterized by a moderate yield but significant historical growth. However, the company’s financial metrics reveal fluctuating returns, highlighting both opportunities and challenges for future income generation. Investors should weigh the stability of its dividends against its historical market performance.
Overview 📊
The dividend overview provides a snapshot of NRG's positioning within the energy sector. The company has maintained dividends for 14 years, indicating stability. However, fluctuations in key metrics could affect long-term sustainability.
| Sector | Dividend Yield (%) | Current Dividend per Share (USD) | Dividend History (Years) | Last Cut or Suspension |
|---|---|---|---|---|
| Utilities | 1.03% | 1.97 | 14 | None |
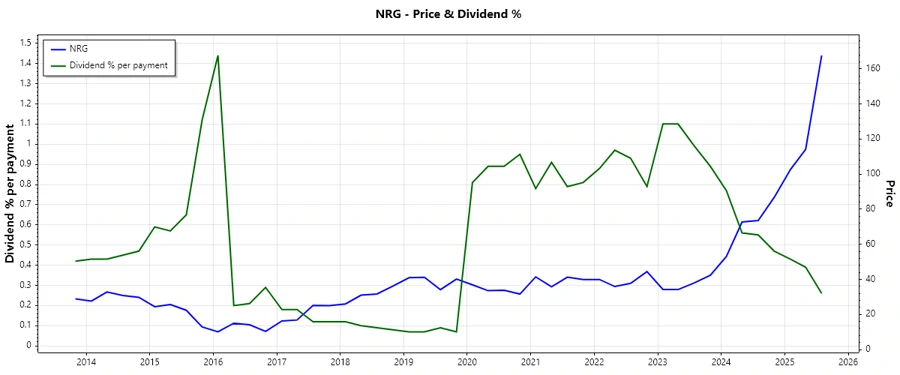
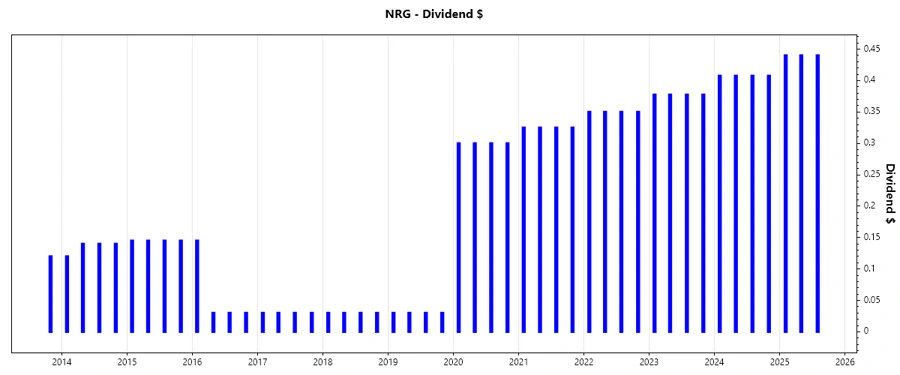
Dividend History 📉
NRG's dividend history indicates moderate growth with consistent payments over years. This stability is crucial for income-focused investors seeking dependability.
| Year | Dividend per Share (USD) |
|---|---|
| 2025 | 1.32 |
| 2024 | 1.63 |
| 2023 | 1.51 |
| 2022 | 1.40 |
| 2021 | 1.30 |
Dividend Growth 📈
The growth of dividends is a vital indicator of company health and investor confidence. NRG has exhibited stable growth over recent years, which suggests a commitment to increasing shareholder returns.
| Time | Growth |
|---|---|
| 3 years | 7.83% |
| 5 years | 68.50% |
The average dividend growth is 68.50% over 5 years. This shows moderate but steady dividend growth.
Payout Ratio ⚠️
The payout ratio is a critical measure of dividend sustainability. A high EPS-based payout ratio may indicate potential overextension, whereas a lower FCF-based ratio suggests safer dividend payments.
| Key Figure | Ratio |
|---|---|
| EPS-based | 73.82% |
| Free cash flow-based | 27.28% |
With a 73.82% EPS payout ratio, NRG appears aggressive in its distribution strategies, whereas a 27.28% FCF payout ratio suggests better coverage relative to cash flow metrics.
Cashflow & Capital Efficiency 🗣️
Cash flow efficiency evaluates a company's ability to generate free cash and manage expenditures. Consistent and positive metrics signal robust financial health and capital allocation efficiency.
| Metric | 2024 | 2023 | 2022 |
|---|---|---|---|
| Free Cash Flow Yield | 9.87% | -6.95% | -0.09% |
| Earnings Yield | 6.05% | -1.71% | 16.26% |
| CAPEX to Operating Cash Flow | 20.47% | 270.59% | 101.94% |
| Stock-based Compensation to Revenue | 0.36% | 0.35% | 0.09% |
| Free Cash Flow / Operating Cash Flow Ratio | 79.53% | 370.59% | -1.94% |
NRG's cash flow metrics indicate fluctuating but generally effective cash management practices, essential for sustaining dividend distributions and funding operations efficiently.
Balance Sheet & Leverage Analysis 💡
A comprehensive balance sheet analysis provides insights into leverage and liquidity. Stability in these metrics ensures strategic advantages and solvency under varying market conditions.
| Metric | 2024 | 2023 | 2022 |
|---|---|---|---|
| Debt-to-Equity | 4.44 | 3.78 | 2.17 |
| Debt-to-Assets | 45.75% | 42.13% | 28.48% |
| Debt-to-Capital | 81.60% | 79.06% | 68.44% |
| Net Debt to EBITDA | 2.86 | 5.96 | 2.81 |
| Current Ratio | 1.02 | 1.02 | 1.25 |
| Quick Ratio | 0.96 | 0.96 | 1.19 |
| Financial Leverage | 9.69 | 8.96 | 7.61 |
NRG shows elevated leverage ratios, suggesting potential risk but also an opportunity for higher returns if managed correctly. Continuous monitoring is essential to maintain financial health.
Fundamental Strength & Profitability 🧮
Fundamental health is assessed through key profitability metrics. High returns suggest effective use of shareholder capital and operational efficiency.
| Metric | 2024 | 2023 | 2022 |
|---|---|---|---|
| Return on Equity | 45.40% | -6.95% | 31.90% |
| Return on Assets | 4.68% | -0.78% | 4.19% |
| Margins: Net | 4.00% | -0.70% | 3.87% |
| EBIT | 7.46% | 1.58% | 6.59% |
| EBITDA | 12.45% | 6.07% | 8.88% |
| Gross | 21.44% | 7.97% | 12.99% |
| Research & Development to Revenue | 0.00% | 0.00% | 0.00% |
Strong ROE and fluctuating profit margins suggest strategic operational efficiencies and challenges amid market conditions. Prudent R&D spending could enhance competitive positioning.
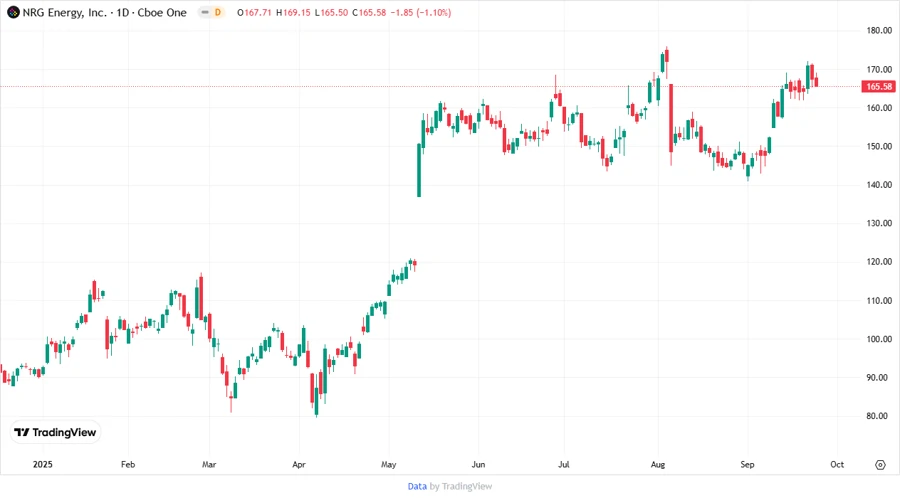
Price Development 💹
Dividend Scoring System ✅
| Criteria | Score | Rating |
|---|---|---|
| Dividend yield | 2 | |
| Dividend Stability | 4 | |
| Dividend growth | 4 | |
| Payout ratio | 3 | |
| Financial stability | 3 | |
| Dividend continuity | 4 | |
| Cashflow Coverage | 3 | |
| Balance Sheet Quality | 2 |
Total Score: 25 out of 40
Rating 🏆
NRG Energy, Inc. presents a balanced dividend profile with consistent growth. The mixed financials suggest moderate risks, but the ongoing market adjustments could position it favorably for the long-term. Investors might consider NRG an intermediate opportunity, reflecting on both the growth potential and inherent risks.
Smart Data Insight
Master the Perfect Entry & Exit for this Stock
Don't leave your profits to chance. Historically, this stock follows specific seasonal patterns that institutional traders use to maximize returns.
- ✅ Identify the "Golden Buying Window"
- ✅ Avoid high-risk correction cycles
- ✅ Backtested data from the last 20+ years