September 01, 2025 a 07:47 am

NRG: Dividend Analysis - NRG Energy, Inc.
NRG Energy, Inc. presents a unique investment opportunity with a blend of moderate dividend yield and growth stability. The company has maintained dividends for 14 consecutive years, showcasing resilience in its cash flow strategies. Despite recent challenges in earnings, NRG maintains a sustainable payout ratio, indicating prudence in its distributions.
📊 Overview
NRG Energy, Inc. operates within the utilities sector, characterized by reliable cash flows essential for stable dividend payouts. The company's current dividend yield stands at 1.03%, with a current dividend per share of USD 1.97. Over the past 14 years, it has developed a consistent dividend history, with no recent cuts or suspensions, evidencing strong dividend management.
| Metric | Value |
|---|---|
| Sector | Utilities |
| Dividend yield | 1.03% |
| Current dividend per share | USD 1.97 |
| Dividend history | 14 years |
| Last cut or suspension | None |
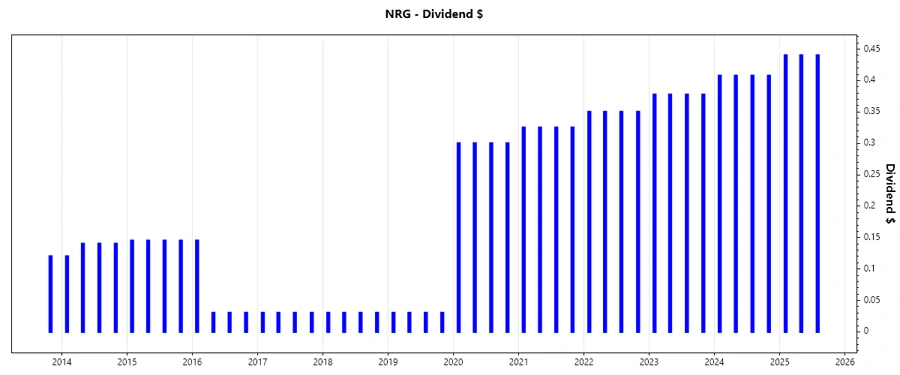
🗣️ Dividend History
The longevity of NRG's dividend payouts over 14 consecutive years indicates strong cash flow management and a committed approach to return capital to shareholders. This is particularly compelling amid economic volatility, showcasing the company’s capacity to perform under variable market conditions.
| Year | Dividend Per Share (USD) |
|---|---|
| 2025 | 1.32 |
| 2024 | 1.63 |
| 2023 | 1.51 |
| 2022 | 1.40 |
| 2021 | 1.30 |
📈 Dividend Growth
NRG Energy's dividend growth reflects moderate upward trends, crucial for long-term income investors seeking steady returns. The growth rate over the past 5 years supports a slowly advancing payout strategy.
| Time | Growth |
|---|---|
| 3 years | 7.83% |
| 5 years | 68.5% |
The average dividend growth is 68.5% over 5 years. This shows moderate but steady dividend growth.
✅ Payout Ratio
A prudent payout ratio is crucial to ensure dividends are sustainable and can weather potential earnings downturns. NRG's payout based on EPS is at 73.82%, which is high but sustainable, while the free cash flow payout ratio is a more conservative 27.28%.
| Key figure | Ratio |
|---|---|
| EPS-based | 73.82% |
| Free cash flow-based | 27.28% |
The EPS-based payout ratio of 73.82% suggests caution for potential earnings fluctuations, while the free cash flow-based ratio shows ample cover for dividend payments.
💵 Cashflow & Capital Efficiency
Evaluating NRG's cash flow and capital allocation metrics is essential for understanding dividend sustainability. The company's cash flow metrics, such as free cash flow yield and CAPEX to operating cash flow ratios, provide insights into its capabilities to fund future dividends and growth.
| Metric | 2024 | 2023 | 2022 |
|---|---|---|---|
| Free Cash Flow Yield | 9.87% | -6.95% | -0.09% |
| Earnings Yield | 6.05% | -1.71% | 16.26% |
| CAPEX to Operating Cash Flow | 20.47% | -270.59% | 101.94% |
| Stock-Based Compensation to Revenue | 0.36% | 0.35% | 0.09% |
| Free Cash Flow / Operating Cash Flow Ratio | 79.53% | 370.59% | -1.94% |
Despite negative cash flow in certain years, the comprehensive view on these metrics suggests challenges in capital efficiency, requiring monitoring to maintain dividend viability.
🏦 Balance Sheet & Leverage Analysis
Understanding NRG's leverage and general balance sheet condition helps assess long-term financial sustainability. Key leverage ratios provide insights into the company’s debt burdens.
| Metric | 2024 | 2023 | 2022 |
|---|---|---|---|
| Debt-to-Equity | 4.435 | 3.775 | 2.169 |
| Debt-to-Assets | 45.75% | 42.13% | 28.48% |
| Debt-to-Capital | 81.60% | 79.06% | 68.44% |
| Net Debt to EBITDA | 2.86 | 5.81 | 2.64 |
| Current Ratio | 0.93 | 1.02 | 1.25 |
| Quick Ratio | 0.96 | 0.96 | 1.19 |
The increasing leverage over recent years suggests reliance on debt financing, potentially impacting future flexibility. The current and quick ratios, however, demonstrate adequate short-term liquidity.
🛠️ Fundamental Strength & Profitability
Assessing profitability through metrics like return on equity (ROE) and various profit margins can indicate how effectively NRG is deploying its resources.
| Metric | 2024 | 2023 | 2022 |
|---|---|---|---|
| Return on Equity | 45.40% | -6.95% | 31.90% |
| Return on Assets | 4.68% | -0.78% | 4.19% |
| Net Margin | 3.99% | -0.70% | 3.87% |
| EBIT Margin | 7.46% | 1.58% | 6.59% |
| EBITDA Margin | 12.45% | 6.23% | 9.45% |
| Gross Margin | 21.44% | 7.97% | 12.73% |
While high ROE signals potential for substantial shareholder returns, the negative figures for some years highlight volatility issues. The improvement in earnings margins over recent periods suggests operational enhancements.
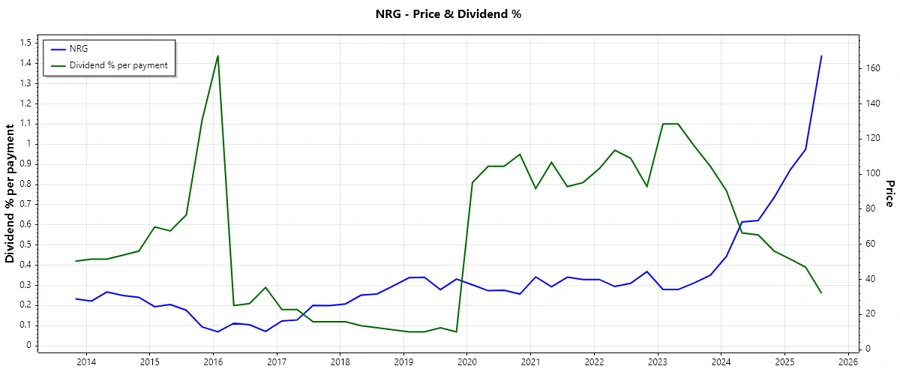
📉 Price Development
🔍 Dividend Scoring System
| Category | Score | Score Bar |
|---|---|---|
| Dividend yield | 3 | |
| Dividend Stability | 4 | |
| Dividend growth | 3 | |
| Payout ratio | 3 | |
| Financial stability | 3 | |
| Dividend continuity | 4 | |
| Cashflow Coverage | 3 | |
| Balance Sheet Quality | 2 |
Total Score: 25 out of 40
🌟 Rating
NRG Energy, Inc. offers a blend of moderate yield and growth potential, although recent financial volatility highlights some risks. It maintains a relatively secure dividend given cash flow management and sector stability. However, potential investors should weigh the leverage and recent profitability challenges. Overall, a cautious yet promising option for dividend-seeking long-term investors.
Smart Data Insight
Master the Perfect Entry & Exit for this Stock
Don't leave your profits to chance. Historically, this stock follows specific seasonal patterns that institutional traders use to maximize returns.
- ✅ Identify the "Golden Buying Window"
- ✅ Avoid high-risk correction cycles
- ✅ Backtested data from the last 20+ years