December 04, 2025 a 02:03 pm

NOW: Trend and Support & Resistance Analysis - ServiceNow, Inc.
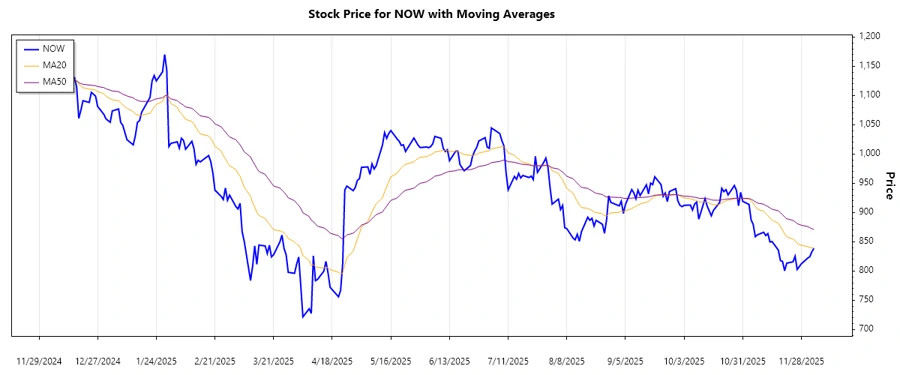
ServiceNow, Inc. presents a dynamic stock performance over recent months with significant movements in both directions. Presently, the data indicates a downward trend, aligning with the cloud computing sector's transitional phase. Investors should monitor technical indicators closely, as emerging support levels could signal potential stabilization. While market volatility presents challenges, strategic entry points might arise for long-term investors.
Trend Analysis
| Date | Close Price | Trend |
|---|---|---|
| 2025-12-04 | $838.89 | ▼ Abwärtstrend |
| 2025-12-03 | $832.9 | ▼ Abwärtstrend |
| 2025-12-02 | $824.38 | ▼ Abwärtstrend |
| 2025-12-01 | $822.07 | ▼ Abwärtstrend |
| 2025-11-28 | $812.41 | ▼ Abwärtstrend |
| 2025-11-26 | $802.72 | ▼ Abwärtstrend |
| 2025-11-25 | $825.31 | ▼ Abwärtstrend |
The analysis of the recent trend in ServiceNow stock prices reveals a clear downward movement, with the EMA20 falling below the EMA50, confirming the dominant downtrend. This might indicate further price declines unless a significant bullish reversal occurs.
Support and Resistance
| Zone Type | From | To |
|---|---|---|
| Support Zone 1 | $800 | $820 |
| Support Zone 2 | $750 | $770 |
| Resistance Zone 1 | $900 | $920 |
| Resistance Zone 2 | $950 | $970 |
Currently, the price of ServiceNow, Inc. shares hovers near the lower support zone, potentially providing a buffering against further declines. However, should the price breach the support, it could fall to the next zone, making resistance levels crucial in determining recovery strength.
Conclusion
The ongoing downward trend in NOW’s stock suggests caution for potential investors. The effective identification of support levels could present opportunities for long-term gains if the trend reverses. However, the current financial climate within the tech sector and broader economic indicators suggest volatility. Close observation of key support and resistance levels will be critical to making timely investment decisions, especially for risk-averse investors seeking to mitigate downside exposure.
JSON Representation: