July 14, 2025 a 08:15 am


NOW: Trend and Support & Resistance Analysis - ServiceNow, Inc.
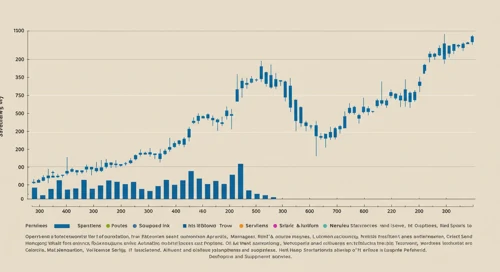
ServiceNow, Inc., known for its enterprise cloud computing solutions, showcases varied trends based on recent stock data. Analyzing these trends helps us understand potential upward or downward movements, enabling better investment decisions. This analysis dives into the technical indicators, providing insights into crucial trends and zones for investors.
Trend Analysis
| Date | Close Price | Trend |
|---|---|---|
| 2025-07-11 | 938.78 | ▼ |
| 2025-07-10 | 968.09 | ▼ |
| 2025-07-09 | 1013.71 | ▲ |
| 2025-07-08 | 1022.98 | ▲ |
| 2025-07-07 | 1035.01 | ▲ |
| 2025-07-03 | 1044.69 | ▲ |
| 2025-07-02 | 1009.76 | ▼ |
The recent trends highlighted a mix of upward and downward movements. Calculations with EMA20 and EMA50 suggest a period of caution as trends seem to bolster mixed signals in the short term.
Support and Resistance
| Zone Type | From | To |
|---|---|---|
| Support | 950.00 | 960.00 |
| Support | 980.00 | 990.00 |
| Resistance | 1030.00 | 1040.00 |
| Resistance | 1060.00 | 1070.00 |
The current stock price sits within a potential support zone, indicating a cautious approach as this support may hold or give way to further declines.
Conclusion
ServiceNow’s stock data presents investors with both opportunity and caution. While certain indicators signal growth potential, others suggest possible downward pressure. Making informed investment decisions requires analyzing these trends and zones, assessing external influences, and staying up-to-date with market conditions. Ultimately, weighing the potential for continued enterprise cloud computing expansion against market volatility remains key for stakeholders.
Smart Data Insight
Master the Perfect Entry & Exit for this Stock
Don't leave your profits to chance. Historically, this stock follows specific seasonal patterns that institutional traders use to maximize returns.
- ✅ Identify the "Golden Buying Window"
- ✅ Avoid high-risk correction cycles
- ✅ Backtested data from the last 20+ years