June 02, 2025 a 02:03 pm


NOW: Trend and Support & Resistance Analysis - ServiceNow, Inc.
ServiceNow, Inc. has showcased a notable recovery in its stock prices over the recent months following an initial decline. The current trend suggests a consistent upward momentum as technical indicators signal optimism. With cloud computing remaining a prominent sector, ServiceNow, Inc. is positioned well to leverage enterprise needs, yet potential volatility remains with global economic shifts.
Trend Analysis
| Date | Close Price | Trend |
|---|---|---|
| 2025-06-02 | 1003.61 | ▲ |
| 2025-05-30 | 1011.09 | ▲ |
| 2025-05-29 | 1015.23 | ▲ |
| 2025-05-28 | 1021.3 | ▲ |
| 2025-05-27 | 1027.39 | ▲ |
| 2025-05-23 | 1004.37 | ▲ |
| 2025-05-22 | 1015.77 | ▲ |
The recent data shows a strong upward trend with the EMA20 consistently above the EMA50, suggesting a bullish outlook that has persisted in the near term. This indicates a continuation of positive sentiment around the stock.
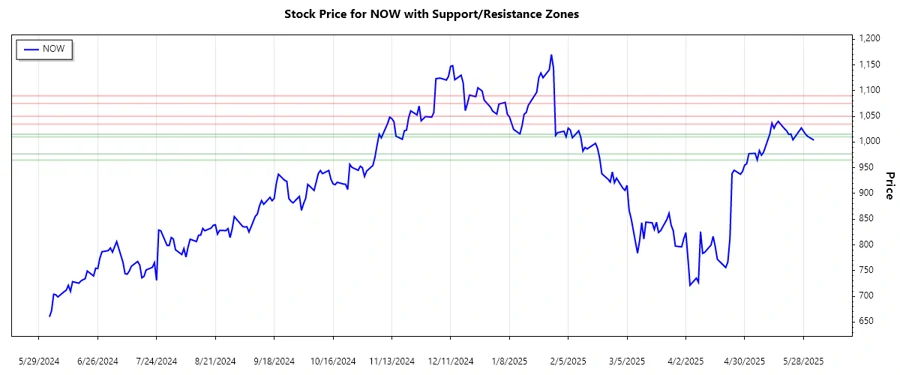
Support and Resistance
| Type | Zone From | Zone To |
|---|---|---|
| Support | 965.00 | 977.00 |
| Support | 1010.00 | 1015.00 |
| Resistance | 1035.00 | 1050.00 |
| Resistance | 1075.00 | 1090.00 |
Currently, the stock price trades within the calculated support zone between 1010.00 and 1015.00. This presence in the support zone suggests the potential for a rebound. However, resistance levels identified ahead could test the persistence of this upward momentum.
Conclusion
The technical analysis for ServiceNow, Inc. indicates a bullish trend backed by rising EMAs, denoting positive investor sentiment. Support zones provide a cushion against significant downturns, but attention should be paid to resistance levels that could challenge upward momentum. Strategic positioning within the workflow automation sector offers growth prospects, countered by global economic uncertainties that could induce volatility.
Smart Data Insight
Master the Perfect Entry & Exit for this Stock
Don't leave your profits to chance. Historically, this stock follows specific seasonal patterns that institutional traders use to maximize returns.
- ✅ Identify the "Golden Buying Window"
- ✅ Avoid high-risk correction cycles
- ✅ Backtested data from the last 20+ years