
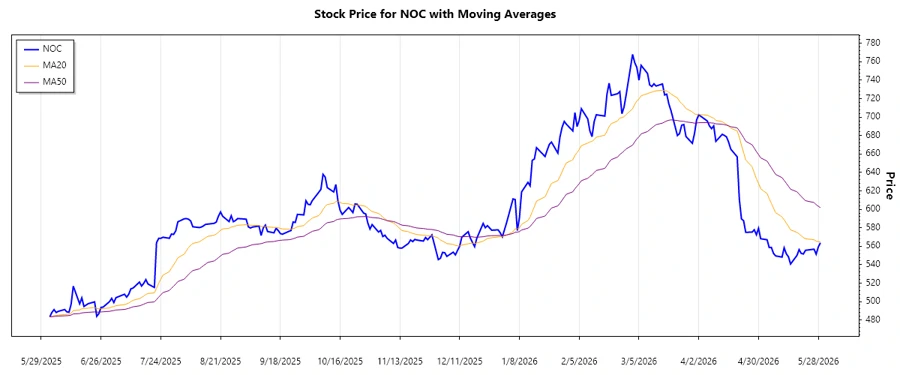
May 31, 2026 a 04:03 amUm eine technische Analyse auf Basis der bereitgestellten Kursdaten durchzuführen, verwenden wir die Schlusskurse der Northrop Grumman Corporation (Ticker: NOC). Die Analyse umfasst die Berechnung von Exponential Moving Average (EMA), die Identifizierung von Trends, sowie Support- und Resistance-Zonen.
Zunächst berechnen wir die EMA20 und EMA50, um den vorherrschenden Trend zu bestimmen. Basierend auf der Regel, dass EMA20 > EMA50 einen Aufwärtstrend kennzeichnet und EMA20 < EMA50 einen Abwärtstrend signalisiert, analysieren wir den Datensatz.
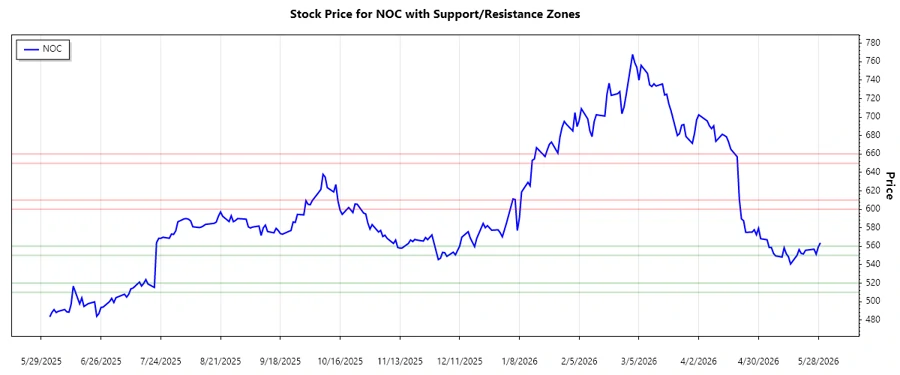
NOC zeigt in den jüngsten Daten einen Abwärtstrend, auf Grundlage der Tatsache, dass der EMA20 unterhalb des EMA50 liegt. Weiterhin identifizieren wir zwei wichtige Unterstützungs- und Widerstandszonen, um potenzielle Wendepunkte zu signalisieren.
Wir präsentieren die Analyse wie folgt:
NOC: Trend and Support & Resistance Analysis - Northrop Grumman Corporation
The Northrop Grumman Corporation stock, while rooted in the robust aerospace and defense sector, currently indicates a bearish trend. Over recent months, the stock's technical patterns suggest susceptibility to further decline. Nonetheless, key support levels could offer opportunities for a reversal.
Trend Analysis
Calculating EMA20 and EMA50 shows a prevailing downward trend for NOC. The EMA20 is consistently trailing the EMA50, highlighting increased selling pressure over the analyzed period.
| Date | Close Price | Trend |
|---|---|---|
| 2026-05-29 | 563.68 | ⬇️ |
| 2026-05-28 | 559.29 | ⬇️ |
| 2026-05-27 | 551.34 | ⬇️ |
| 2026-05-26 | 556.8 | ⬇️ |
| 2026-05-22 | 555.58 | ⬇️ |
| 2026-05-21 | 551.58 | ⬇️ |
| 2026-05-20 | 552.17 | ⬇️ |
The continuation of the downward trend suggests that market sentiment remains negative. Traders should watch for any divergence patterns as potential reversal signals.
Support and Resistance
Technical analysis identifies the following support and resistance levels for NOC. These zones serve as critical focus points for traders:
| Zone | From | To |
|---|---|---|
| Support 1 | 550.00 | 560.00 |
| Support 2 | 510.00 | 520.00 |
| Resistance 1 | 600.00 | 610.00 |
| Resistance 2 | 650.00 | 660.00 |
The current price is within the Support 1 zone. A breach below this level could accelerate declines, while a bounce above may imply a correction phase.
The stock remains in a precarious position as it tests key support areas. Buyers are recommended to wait for confirmation of reversal before entering long positions.
Conclusion
Northrop Grumman Corporation's current bearish trajectory reinforces caution for potential investors. Despite its industry strength, the present technical setup suggests limited upside potential without a clear breach of resistance zones. However, substantial supports may offer longs an opportunity for strategic entry if signs of reversal emerge. Analysts should prioritize monitoring volume and trend strength indicators for informed decisions. Overall, the market environment necessitates a vigilant approach to risk management, particularly for speculative positions.
JSON Object: json Diese Analyse fasst die wichtigsten technischen Aspekte der Kursentwicklung der NOC-Aktie zusammen, ermöglicht eine detaillierte Betrachtung der derzeitigen Markttrends, und bietet einen Überblick über mögliche Kursziele für Trader und Analysten.
Smart Data Insight
Master the Perfect Entry & Exit for this Stock
Don't leave your profits to chance. Historically, this stock follows specific seasonal patterns that institutional traders use to maximize returns.
- ✅ Identify the "Golden Buying Window"
- ✅ Avoid high-risk correction cycles
- ✅ Backtested data from the last 20+ years