November 10, 2025 a 08:15 am## NOC: Trend and Support & Resistance Analysis - Northrop Grumman Corporation
 ## Trend Analysis
 ## Support and Resistance
 ## Conclusion
The NOC stock is experiencing a downward trend, as confirmed by the EMA calculations and recent price movements within established support levels. With resistance levels observed below 600, it faces challenges in establishing upward momentum. Investors must consider potential market catalysts that could alter the current trend. Given the critical support zone testing, the stock remains at a potentially pivotal stage, requiring vigilance for any emerging bullish signals. A breakthrough could trigger significant investor interest and altered trajectories. However, failure to maintain support may result in continued decline.
## Conclusion
The NOC stock is experiencing a downward trend, as confirmed by the EMA calculations and recent price movements within established support levels. With resistance levels observed below 600, it faces challenges in establishing upward momentum. Investors must consider potential market catalysts that could alter the current trend. Given the critical support zone testing, the stock remains at a potentially pivotal stage, requiring vigilance for any emerging bullish signals. A breakthrough could trigger significant investor interest and altered trajectories. However, failure to maintain support may result in continued decline.
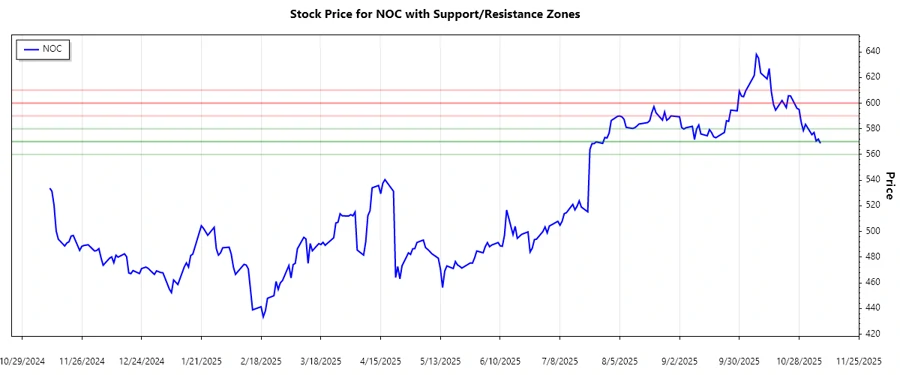
The Northrop Grumman Corporation, well-established in the aerospace and defense industry, has shown varying stock price trends over time. Based on the provided data, the following analysis includes the trend overview, support, and resistance zones to assess the current stock positioning. The computed EMAs help determine whether the NOC stock is in an upward trend, downward trend, or range-bound.
The recent analysis of the NOC stock price indicates a complex movement in the market. Calculating the EMA20 and EMA50 reveals the presence of a specific trend. Illustrated below is the analysis from the last seven trading days:
| Date | Closing Price | Trend Indicator |
|---|---|---|
| 2025-11-07 | 568.61 | ▼ |
| 2025-11-06 | 571.96 | ▼ |
| 2025-11-05 | 570.50 | ▼ |
| 2025-11-04 | 577.14 | ▼ |
| 2025-11-03 | 575.41 | ▼ |
| 2025-10-31 | 583.45 | ▼ |
| 2025-10-30 | 578.60 | ▼ |
The EMA analysis suggests ▼ Downtrend, as the EMA20 is consistently below the EMA50. The stock seems to be under pressure, lacking significant momentum to break above the crucial moving averages, indicating an ongoing bearish sentiment.
## Support and Resistance
With the analyzed data, the support and resistance zones were deduced. These zones play a significant role in predicting potential price action:
| Zone Type | From | To |
|---|---|---|
| Support ▲ | 570.00 | 580.00 |
| Support ▲ | 560.00 | 570.00 |
| Resistance ▼ | 590.00 | 600.00 |
| Resistance ▼ | 600.00 | 610.00 |
Currently, the stock price resides in the lower support zone, struggling to break free from bearish pressure. Continuous monitoring of these zones is crucial to understanding price movements.
## Conclusion
The NOC stock is experiencing a downward trend, as confirmed by the EMA calculations and recent price movements within established support levels. With resistance levels observed below 600, it faces challenges in establishing upward momentum. Investors must consider potential market catalysts that could alter the current trend. Given the critical support zone testing, the stock remains at a potentially pivotal stage, requiring vigilance for any emerging bullish signals. A breakthrough could trigger significant investor interest and altered trajectories. However, failure to maintain support may result in continued decline.
Smart Data Insight
Master the Perfect Entry & Exit for this Stock
Don't leave your profits to chance. Historically, this stock follows specific seasonal patterns that institutional traders use to maximize returns.
- ✅ Identify the "Golden Buying Window"
- ✅ Avoid high-risk correction cycles
- ✅ Backtested data from the last 20+ years