October 06, 2025 a 03:16 am
NOC: Trend and Support & Resistance Analysis - Northrop Grumman Corporation
Northrop Grumman Corporation, a leader in aerospace and defense, has witnessed significant fluctuations in its stock price, reflecting the dynamic nature of the global defense industry. Recent trends indicate a strengthening position, supported by technological advancements and strategic acquisitions. However, geopolitical tensions and budget constraints remain critical factors influencing its market performance. This analysis provides a detailed insight into the technical trend and support/resistance zones, offering a comprehensive overview for investors.
Trend Analysis
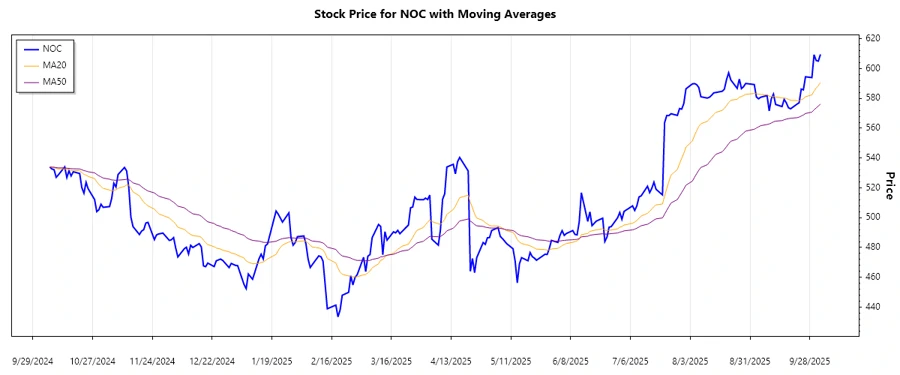
Analyzing the recent daily closing prices, we observe a sequential tightening of the EMA20 above the EMA50, signaling a ▲ uptrend. The momentum in the stock price is indicative of strengthening investor confidence in Northrop Grumman's market positioning.
| Date | Close Price | Trend |
|---|---|---|
| 2025-10-03 | 609.54 | ▲ Uptrend |
| 2025-10-02 | 605.01 | ▲ Uptrend |
| 2025-10-01 | 605.42 | ▲ Uptrend |
| 2025-09-30 | 609.32 | ▲ Uptrend |
| 2025-09-29 | 593.99 | ▼ Downtrend |
| 2025-09-26 | 594.52 | ▼ Downtrend |
| 2025-09-25 | 585.77 | ▼ Downtrend |
The recent increase in closing prices suggests an improving market sentiment, potentially situating Northrop Grumman in a favorable position against its competitors.
Support and Resistance
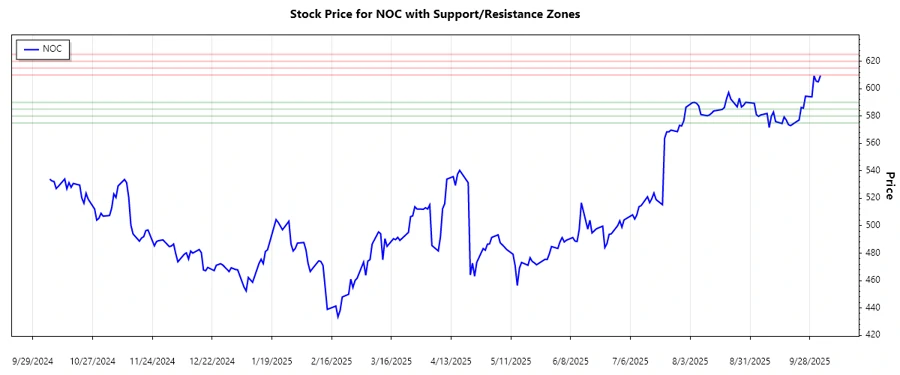
Utilizing the historical closing prices, we observe the definition of two relative zones of support at 585 and 575, and resistance at 610 and 620. These levels are critical as current price movements gravitate towards, confirming or failing these critical points.
| Zone Type | From | To |
|---|---|---|
| Support Zone 1 | ⬇️ 585.00 | ⬇️ 590.00 |
| Support Zone 2 | ⬇️ 575.00 | ⬇️ 580.00 |
| Resistance Zone 1 | ⬆️ 610.00 | ⬆️ 615.00 |
| Resistance Zone 2 | ⬆️ 620.00 | ⬆️ 625.00 |
Current pricing falls within the resistance zones, indicating a potential retest of the 620 levels. This behavior is crucial for understanding future movement and risk weight.
Conclusion
Northrop Grumman Corporation stands at an interesting juncture, with potential uptrends providing optimism for investors but requiring careful monitoring of support/resistance levels. The recent bullish trend signifies an opportunity, though it's necessary to remain cognizant of external factors such as regulatory changes and defense spending adjustments, which could impact performance. Continual assessment of the technical charts, support, and resistance levels will determine the strategic direction, empowering analysts to make informed decisions.
Smart Data Insight
Master the Perfect Entry & Exit for this Stock
Don't leave your profits to chance. Historically, this stock follows specific seasonal patterns that institutional traders use to maximize returns.
- ✅ Identify the "Golden Buying Window"
- ✅ Avoid high-risk correction cycles
- ✅ Backtested data from the last 20+ years