June 21, 2025 a 04:03 am

NOC: Trend and Support & Resistance Analysis - Northrop Grumman Corporation
The Northrop Grumman Corporation (NOC) displays interesting movements in its stock price. Engaging in the aerospace and defense industry, NOC’s value has seen fluctuations indicative of market adaptability. Recent trends suggest specific technical patterns, valuable for analyzing investment potentials.
Trend Analysis
After analyzing Northrop Grumman's recent stock data, the moving averages (EMA20 and EMA50) indicate a significant trend direction. By evaluating these position indicators, we can observe the prevailing trend and potential price movement direction.
| Date | Close Price | Trend |
|---|---|---|
| 2025-06-20 | $497.70 | ⚖️ |
| 2025-06-18 | $494.65 | ▲ |
| 2025-06-17 | $503.97 | ▲ |
| 2025-06-16 | $497.52 | ▲ |
| 2025-06-13 | $516.72 | ▲ |
| 2025-06-12 | $497.13 | ▼ |
| 2025-06-11 | $488.46 | ▼ |
The short-term moving average (EMA20) and long-term moving average (EMA50) suggest a sideways trend as EMA20 hovers around EMA50.
Support- and Resistance
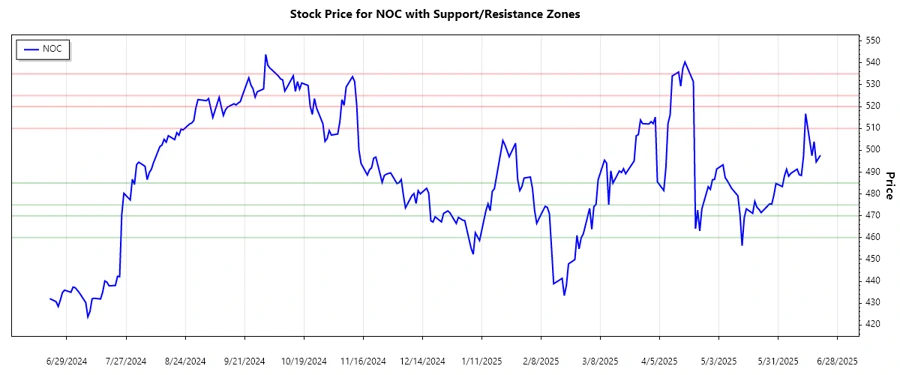
Determining support and resistance zones is crucial for understanding potential price stop and reversal points. Analyzing historical closing prices helps identify these pivotal areas.
| Zone | From | To |
|---|---|---|
| Support Zone 1 | $475.00 | $485.00 |
| Support Zone 2 | $460.00 | $470.00 |
| Resistance Zone 1 | $510.00 | $520.00 |
| Resistance Zone 2 | $525.00 | $535.00 |
The current price of $497.70 places NOC within the first support zone range, highlighting its significance in potential price rebound scenarios.
Conclusion
The recent analysis of Northrop Grumman Corporation indicates a balanced market stance with a tendency towards a stable sideways movement. By aligning in a support zone, the stock demonstrates resilience to downside risk while maintaining proximity to pivotal price levels. This technical composition suggests potential accumulation opportunities, offering a strategic view for long-term investors. However, global dynamics and sector-specific trends must be continuously evaluated to navigate inherent risks.
Smart Data Insight
Master the Perfect Entry & Exit for this Stock
Don't leave your profits to chance. Historically, this stock follows specific seasonal patterns that institutional traders use to maximize returns.
- ✅ Identify the "Golden Buying Window"
- ✅ Avoid high-risk correction cycles
- ✅ Backtested data from the last 20+ years