May 16, 2026 a 07:46 am
NOC: Dividend Analysis - Northrop Grumman Corporation
The Northrop Grumman Corporation (NOC) stands as a robust player in the defense sector, known for its reliable dividend payments extending over 45 years. With a divinely modest yield of approximately 1.27%, investors can appreciate the company's consistent dividend growth and stable payout ratios. The firm's financials reflect a well-managed balance sheet, suggesting a steady income stream for value-focused investors.
📊 Overview
The Northrop Grumman Corporation operates within the defense sector, offering innovative solutions globally. The company's current dividend yield stands at 1.27%, with a dividend per share of $9.01. Over the last 45 years, it has never cut its dividend, a testament to its financial resilience and commitment to shareholders.
| Metric | Value |
|---|---|
| Sector | Defense |
| Dividend yield | 1.27 % |
| Current dividend per share | $9.01 USD |
| Dividend history | 45 years |
| Last cut or suspension | None |
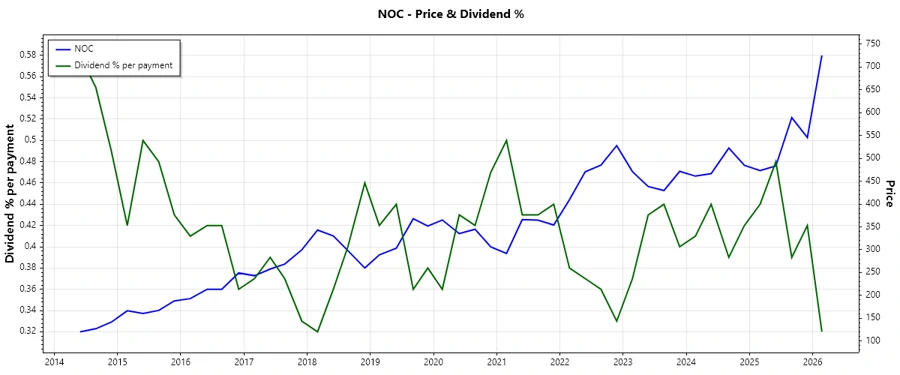
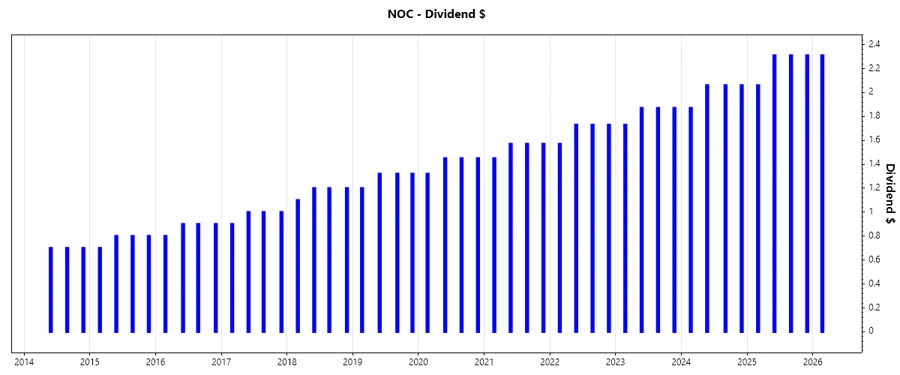
📈 Dividend History
Over the years, Northrop Grumman has showcased a commendable track record for maintaining and increasing dividend payouts. This history is crucial as it reflects the company's commitment to returning value to shareholders even during varied economic cycles.
| Year | Dividend per Share (USD) |
|---|---|
| 2026 | 2.31 |
| 2025 | 8.99 |
| 2024 | 8.05 |
| 2023 | 7.34 |
| 2022 | 6.76 |
🏆 Dividend Growth
Evaluating dividend growth provides insight into future potential payouts. Northrop Grumman exhibits a 3-year dividend growth rate of approximately 9.97% and a 5-year rate of 9.66%. These figures hint at stable annual increases, indicative of sound operational profits.
| Time | Growth |
|---|---|
| 3 years | 9.97 % |
| 5 years | 9.66 % |
The average dividend growth is 9.66% over 5 years. This shows moderate but steady dividend growth.
✅ Payout Ratio
The payout ratio is a valuable metric for assessing a company’s dividend sustainability. Northrop Grumman's EPS-based payout ratio is 27.98%, and its FCF-based payout ratio is 38.72%, both of which highlight a secure buffer and the ability to sustain dividends.
| Key figure ratio | Value (%) |
|---|---|
| EPS-based | 27.98 |
| Free cash flow-based | 38.72 |
These payout ratios suggest that Northrop Grumman maintains healthy financial practices, efficiently covering its dividend obligations without stretching its earnings or free cash flow.
⚙️ Cashflow & Capital Efficiency
Understanding capital efficiency is crucial for long-term investors. Northrop Grumman's free cash flow yield, earnings yield, and CAPEX to operating cash flow metrics offer insights into its ability to generate profits from its capital expenditures. The company's free cash flow to operating cash flow ratio further emphasizes the efficiency of converting earnings into free cash flow.
| Year | 2023 | 2024 | 2025 |
|---|---|---|---|
| Free Cash Flow Yield | 2.96% | 3.80% | 4.04% |
| Earnings Yield | 2.90% | 6.05% | 5.11% |
| CAPEX / Operating Cash Flow | 45.80% | 40.27% | 30.48% |
| Stock-based Compensation / Revenue | 0.22% | 0.25% | 0.28% |
| Free Cash Flow / Operating Cash Flow Ratio | 54.19% | 59.73% | 69.52% |
The cash flow figures reflect strong operational efficiency and strategic allocation of resources, affirming Northrop Grumman's ability to sustain and grow its cash generative capacity.
💰 Balance Sheet & Leverage Analysis
The leverage metrics provide insights into the company’s debt levels and ability to service its obligations. The ratios indicate a controlled debt structure, with a stable debt-to-equity ratio, reasonable current and quick ratios, showcasing balance sheet strength.
| Year | 2023 | 2024 | 2025 |
|---|---|---|---|
| Debt-to-Equity | 1.21 | 1.32 | 1.18 |
| Debt-to-Assets | 38.54% | 40.91% | 38.42% |
| Debt-to-Capital | 54.80% | 56.91% | 54.21% |
| Net Debt to EBITDA | 3.51 | 2.32 | 2.13 |
| Current Ratio | 1.13 | 0.99 | 1.09 |
| Quick Ratio | 1.04 | 0.89 | 0.99 |
| Financial Leverage | 3.15 | 3.23 | 3.08 |
Overall, Northrop Grumman's debt management ensures a sustainable approach towards growth while maintaining operational fluidity and financial flexibility.
📈 Fundamental Strength & Profitability
Profitability metrics offer a glimpse into operational success and financial health. Northrop Grumman’s strong returns on equity and assets, coupled with healthy margins, depict a capable management team keen on driving profitability.
| Year | 2023 | 2024 | 2025 |
|---|---|---|---|
| Return on Equity | 13.90% | 27.30% | 25.08% |
| Return on Assets | 4.42% | 8.46% | 8.14% |
| Margins: Net | 5.23% | 10.17% | 9.97% |
| EBIT | 7.36% | 13.33% | 13.66% |
| EBITDA | 10.76% | 16.67% | 17.17% |
| Gross | 16.67% | 20.38% | 19.81% |
| R&D to Revenue | 3.05% | 2.68% | 2.62% |
The company's financial strength and operational efficiency are apparent, providing confidence in its long-term profitability prospects.
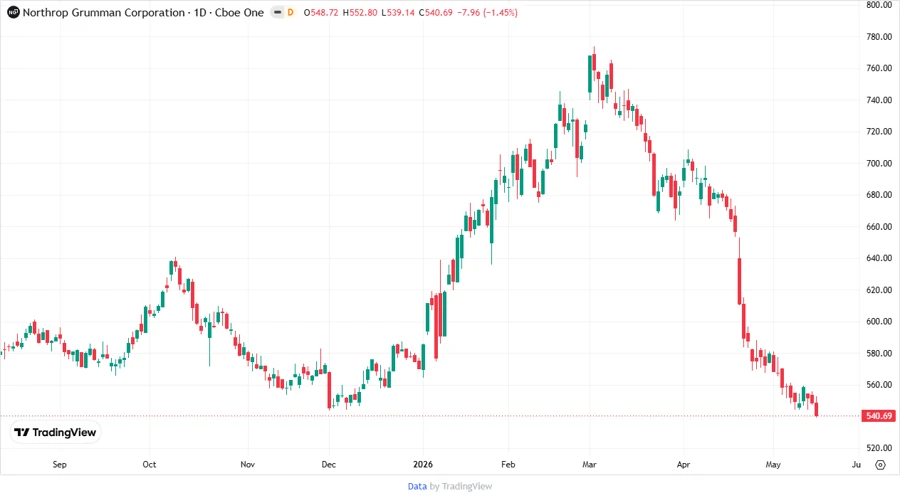
📈 Price Development
🗣️ Dividend Scoring System
| Criteria | Score | Score Bar |
|---|---|---|
| Dividend yield | 3 | |
| Dividend Stability | 5 | |
| Dividend growth | 4 | |
| Payout ratio | 4 | |
| Financial stability | 5 | |
| Dividend continuity | 5 | |
| Cashflow Coverage | 4 | |
| Balance Sheet Quality | 5 |
Total Score: 35/40
📉 Rating & Recommendation
Northrop Grumman Corporation presents a compelling case for inclusion in a dividend-focused portfolio. Its strong dividend history, impressive financial stability, and consistent growth signal a reliable investment opportunity with moderate risk. Investors seeking a steady income stream combined with long-term growth may find NOC a worthy addition.
Smart Data Insight
Master the Perfect Entry & Exit for this Stock
Don't leave your profits to chance. Historically, this stock follows specific seasonal patterns that institutional traders use to maximize returns.
- ✅ Identify the "Golden Buying Window"
- ✅ Avoid high-risk correction cycles
- ✅ Backtested data from the last 20+ years