
April 14, 2026 a 07:46 am

NOC: Dividend Analysis - Northrop Grumman Corporation
Northrop Grumman Corporation, with a strong dividend history spanning multiple decades, offers investors a unique profile blending stability with moderate growth potential. The company's strategic dividend payouts reflect a commitment to shareholder returns, despite a modest dividend yield. Analyzing their payout ratios and growth prospects, Northrop Grumman stands as a robust player within the aerospace and defense sector.
📊 Overview
Northrop Grumman Corporation operates within the Aerospace and Defense sector. The company's current dividend yield sits at 1.27%, with a dividend per share of $9.01. With an impressive 45-year history of consistent dividend payouts and no recent cuts or suspensions, the firm demonstrates a strong commitment to returning value to shareholders.
| Category | Details |
|---|---|
| Sector | Aerospace and Defense |
| Dividend yield | 1.27 % |
| Current dividend per share | 9.01 USD |
| Dividend history | 45 years |
| Last cut or suspension | None |
🗣️ Dividend History
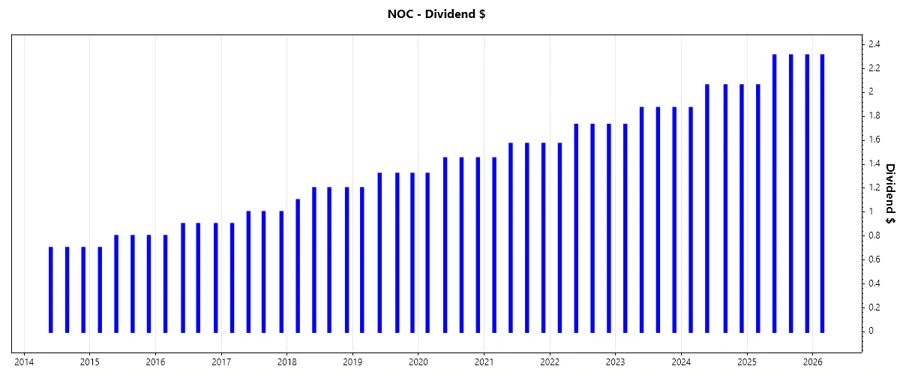
With a robust track record, Northrop Grumman has delivered consistent dividends over the years, underscoring reliability and stability investors often seek. This historical performance acts as a barometer, signaling the company's longstanding financial health and operational efficiency.
| Year | Dividend per Share (USD) |
|---|---|
| 2026 | 2.31 |
| 2025 | 8.99 |
| 2024 | 8.05 |
| 2023 | 7.34 |
| 2022 | 6.76 |
📈 Dividend Growth
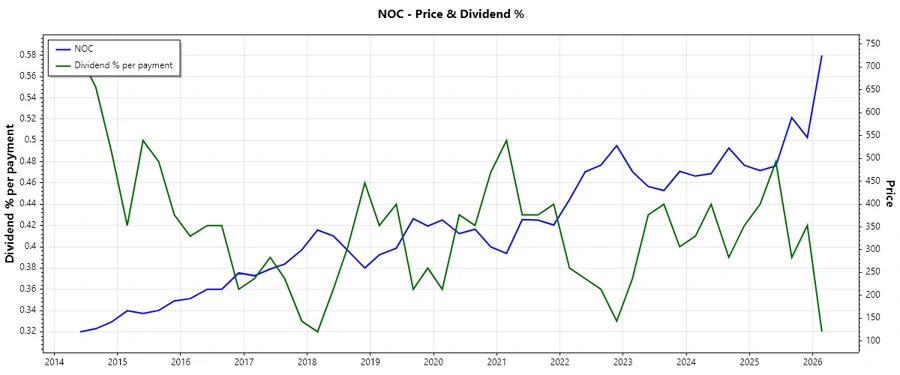
Examining Northrop Grumman's dividend growth offers insight into the company's strategic earnings reinvestment alongside shareholder returns. The firm reports a three-year dividend growth of approximately 9.97% and a five-year growth of about 9.66%, reflecting a moderate yet reliable upward dividend trajectory that balances investor expectations with internal growth reinvestment.
| Time | Growth |
|---|---|
| 3 years | 9.97 % |
| 5 years | 9.66 % |
The average dividend growth is 9.66% over 5 years. This shows moderate but steady dividend growth.
🧮 Payout Ratio
The payout ratio is a vital indicator of dividend sustainability. Northrop Grumman's EPS-based payout ratio stands at 30.79%, while the free cash flow-based ratio is 38.67%. These figures suggest the company retains a significant portion of its earnings, ensuring flexibility for future investments and stability in dividend payments.
| Key figure | Ratio |
|---|---|
| EPS-based | 30.79 % |
| Free cash flow-based | 38.67 % |
Given the EPS and FCF payout ratios, the company's dividends appear sustainable, with ample coverage margin to safeguard against earnings fluctuations, testifying to Northrop Grumman's prudent financial management.
🚀 Cashflow & Capital Efficiency
Assessing cash flow and capital efficiency is crucial for evaluating a company's financial robustness and operational prowess. Northrop Grumman's financial metrics, including free cash flow yield and CAPEX to operating cash flow ratios, are pivotal for understanding liquidity and resource allocation.
| Year | 2025 | 2024 | 2023 |
|---|---|---|---|
| Free Cash Flow Yield | 4.04 % | 3.79 % | 2.96 % |
| Earnings Yield | 5.11 % | 6.05 % | 2.90 % |
| CAPEX to Operating Cash Flow | 30.48 % | 40.27 % | 45.81 % |
| Stock-based Compensation to Revenue | 0.28 % | 0.25 % | 0.22 % |
| Free Cash Flow / Operating Cash Flow | 69.52 % | 59.73 % | 54.19 % |
Northrop Grumman's cash flow stability and effective capital use strategy are well-highlighted through these metrics, underscoring a strong operational resilience and effective asset utilization.
⚙️ Balance Sheet & Leverage Analysis
The company's balance sheet and leverage ratios highlight its financial stability and debt management. Key considerations include debt-to-equity and current ratios, which are fundamental in assessing liquidity risks and capital structure strength.
| Year | 2025 | 2024 | 2023 |
|---|---|---|---|
| Debt-to-Equity | 1.18 | 1.32 | 1.21 |
| Debt-to-Assets | 38.42 % | 40.91 % | 38.54 % |
| Debt-to-Capital | 54.21 % | 56.91 % | 54.80 % |
| Net Debt to EBITDA | 2.13 | 2.32 | 3.51 |
| Current Ratio | - | - | 1.13 |
| Quick Ratio | 0.99 | 0.89 | 1.04 |
| Financial Leverage | 3.08 | 3.23 | 3.15 |
The healthy balance between leverage, liquidity, and capital equity suggests a resilient financial structure poised to weather economic fluctuations.
🔍 Fundamental Strength & Profitability
Fundamental profitability metrics are central to evaluating Northrop Grumman's operational success. Key indicators such as return on equity and net margins provide insight into its efficiency and profitability.
| Year | 2025 | 2024 | 2023 |
|---|---|---|---|
| Return on Equity | 25.08 % | 27.30 % | 13.90 % |
| Return on Assets | 8.14 % | 8.46 % | 4.42 % |
| Margins: Net | 9.97 % | 10.17 % | 5.23 % |
| EBIT | 13.66 % | 13.33 % | 7.36 % |
| EBITDA | 17.17 % | 16.67 % | 10.76 % |
| Gross | 19.81 % | 20.38 % | 16.67 % |
| R&D to Revenue | 2.62 % | 2.68 % | 3.05 % |
Despite challenging market conditions, Northrop Grumman showcases a robust profitability framework that supports ongoing innovation and shareholder returns.
📉 Price Development
✅ Dividend Scoring System
Assessing the Northrop Grumman Corporation through a dividend-scoring framework reveals how effectively the company meets various key performance indicators critical to shareholder returns.
| Criteria | Score (1-5) | |
|---|---|---|
| Dividend yield | 3 | |
| Dividend Stability | 5 | |
| Dividend growth | 4 | |
| Payout ratio | 4 | |
| Financial stability | 5 | |
| Dividend continuity | 5 | |
| Cashflow Coverage | 4 | |
| Balance Sheet Quality | 5 |
Total Score: 35/40
✅ Rating
Northrop Grumman Corporation receives a robust rating through our comprehensive dividend analysis, highlighting its strong financial footing, consistent dividend growth, and effective capital management. The company's resilience within the defense sector, matched with an investor-friendly dividend policy, positions it as a favorable choice for dividend-focused portfolios.
Smart Data Insight
Master the Perfect Entry & Exit for this Stock
Don't leave your profits to chance. Historically, this stock follows specific seasonal patterns that institutional traders use to maximize returns.
- ✅ Identify the "Golden Buying Window"
- ✅ Avoid high-risk correction cycles
- ✅ Backtested data from the last 20+ years