March 14, 2026 a 03:31 pm

NOC: Dividend Analysis - Northrop Grumman Corporation
Northrop Grumman Corporation (NOC) showcases a robust dividend profile with a commendable track record of consistent payouts over the years. Their conservative payout ratios and solid growth history highlight their commitment to returning value to shareholders. Despite current market conditions, Northrop Grumman remains a stable choice for dividend-focused investors due to its strategic sector presence and steady cash flows.
📊 Overview
Northrop Grumman operates within the Aerospace & Defense sector, offering essential services and products worldwide. The company boasts a dividend yield of 1.27%, with a current dividend per share of $9.01. Remarkably, Northrop Grumman has maintained a dividend history for 45 years, with no recent cuts or suspensions. This establishes it as a reliable entity within its industry.
| Sector | Dividend Yield (%) | Dividend per Share (USD) | Dividend History (Years) | Last Cut/Suspension |
|---|---|---|---|---|
| Aerospace & Defense | 1.27 | 9.01 | 45 | None |
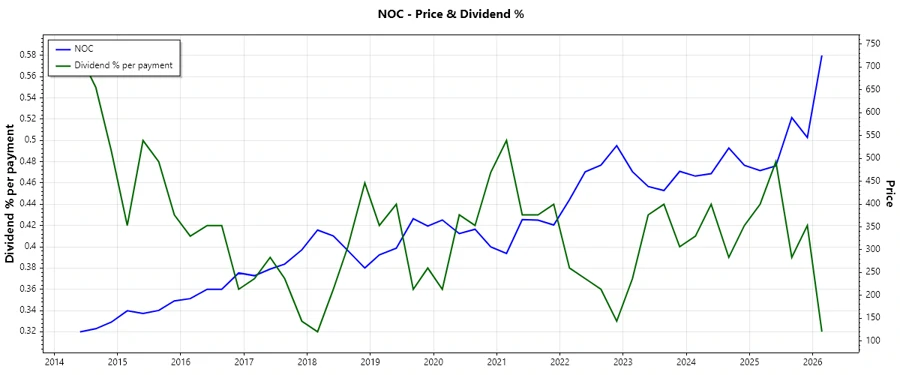
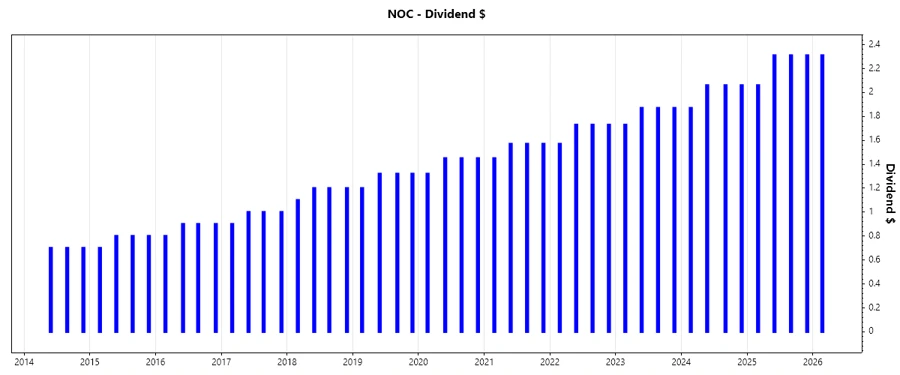
🗣️ Dividend History
The dividend history reflects Northrop Grumman's commitment to shareholder value. A consistent payment record can signal financial health and management's positive outlook on future earnings. Investors typically value a sustained and rising dividend over volatile payments.
| Year | Dividend per Share (USD) |
|---|---|
| 2026 | 2.31 |
| 2025 | 8.99 |
| 2024 | 8.05 |
| 2023 | 7.34 |
| 2022 | 6.76 |
📈 Dividend Growth
An evaluation of Northrop Grumman's dividend growth over time underscores its ability to enhance shareholder value through increasing payouts. Investors eye growth trends to assess the long-term viability of dividends.
| Time | Growth (%) |
|---|---|
| 3 years | 9.97 |
| 5 years | 9.66 |
The average dividend growth is 9.66% over 5 years. This shows moderate but steady dividend growth, reflecting sound strategic planning and robust operating performance.
📉 Payout Ratio
Payout ratios, both EPS and Free Cash Flow-based, provide a picture of dividend sustainability. Low ratios suggest financial flexibility in maintaining and raising dividends.
| Key figure | Ratio (%) |
|---|---|
| EPS-based | 30.78 |
| Free cash flow-based | 38.67 |
With an EPS-based payout ratio of 30.78% and a FCF-based ratio of 38.67%, Northrop Grumman is well positioned to continue its dividend policy and even potentially increase payouts without excessive strain on resources.
🔍 Cashflow & Capital Efficiency
Understanding cash flow dynamics and capital efficiency metrics helps stakeholders gauge financial health and profit reinvestment capability. High-quality cash flows combined with improved capital efficiency can signal a robust financial structure.
| Year | 2025 | 2024 | 2023 |
|---|---|---|---|
| Free Cash Flow Yield | 4.04% | 3.80% | 2.96% |
| Earnings Yield | 5.11% | 6.05% | 2.90% |
| CAPEX to Operating Cash Flow | 30.48% | 40.27% | 45.80% |
| Stock-based Compensation to Revenue | 0.28% | 0.25% | 0.22% |
| Free Cash Flow / Operating Cash Flow Ratio | 69.52% | 59.73% | 54.19% |
With a solid earnings yield and efficient capital reinvestment ratios, Northrop Grumman projects stability in cash generation and judicious capital utilization.
💵 Balance Sheet & Leverage Analysis
The balance sheet metrics, notably leverage ratios, offer insights on financial risk and potential liquidity issues. Prudence in leveraging can sustain a company's operational flexibility.
| Year | 2025 | 2024 | 2023 |
|---|---|---|---|
| Debt-to-Equity | 1.18 | 1.32 | 1.21 |
| Debt-to-Assets | 38.42% | 40.91% | 38.54% |
| Debt-to-Capital | 54.21% | 56.91% | 54.80% |
| Net Debt to EBITDA | 2.13 | 2.32 | 3.51 |
| Current Ratio | 1.09 | - | 1.13 |
| Quick Ratio | 0.99 | 0.89 | 1.04 |
| Financial Leverage | 3.08 | 3.23 | 3.15 |
While the leverage ratios are relatively high, a consistent quick and current ratio indicate manageable liquidity levels and financial protection.
🚀 Fundamental Strength & Profitability
Profitability ratios highlight management's efficiency in driving returns and maintaining cost effectiveness. Return metrics can gauge long-term viability and competitive advantages.
| Year | 2025 | 2024 | 2023 |
|---|---|---|---|
| Return on Equity | 25.08% | 27.30% | 13.90% |
| Return on Assets | 8.14% | 8.46% | 4.42% |
| Margins: Net | 9.97% | 10.17% | 5.23% |
| Margins: EBIT | 13.66% | 13.33% | 7.36% |
| Margins: EBITDA | 17.17% | 16.67% | 10.76% |
| Margins: Gross | 19.81% | 20.38% | 16.67% |
| Research & Development to Revenue | 2.62% | 2.68% | 3.05% |
Given a high ROE and stable gross margins, Northrop Grumman remains profitable while making strategic investments in R&D, ensuring competitiveness and innovation.
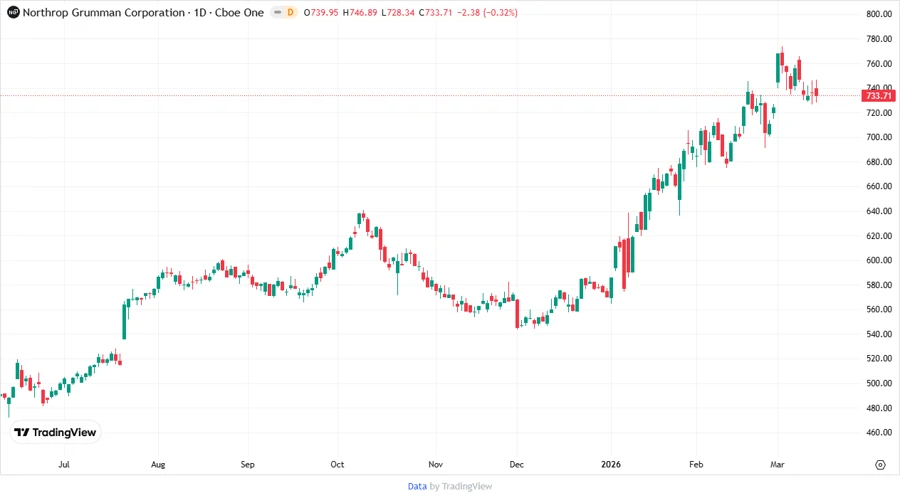
📈 Price Development
✅ Dividend Scoring System
| Category | Score (1-5) | Score Bar |
|---|---|---|
| Dividend Yield | 3 | |
| Dividend Stability | 5 | |
| Dividend Growth | 4 | |
| Payout Ratio | 5 | |
| Financial Stability | 4 | |
| Dividend Continuity | 5 | |
| Cashflow Coverage | 4 | |
| Balance Sheet Quality | 3 |
Total Score: 33/40
🗣️ Rating
Northrop Grumman Corp. (NOC) stands as a solid investment opportunity for dividend-focused investors. With a rich history of disciplined payouts and strategic growth metrics, the corporation is well positioned to continue its role as a reliable dividend payer amidst its industry peers. Recommended as a "Buy" for investors seeking stable and consistent income.