February 01, 2026 a 12:47 pm


NOC: Dividend Analysis - Northrop Grumman Corporation
Northrop Grumman Corporation presents a robust dividend profile, with steady growth and a solid history of dividend distributions. As a leader in the aerospace and defense sector, its financial strategies continue to create value for shareholders through disciplined capital management and a commitment to sustainable dividend payments.
📊 Overview
| Metric | Value |
|---|---|
| Sector | Aerospace & Defense |
| Dividend Yield | 1.65% |
| Current Dividend per Share | 9.01 USD |
| Dividend History | 44 years |
| Last Cut or Suspension | None |
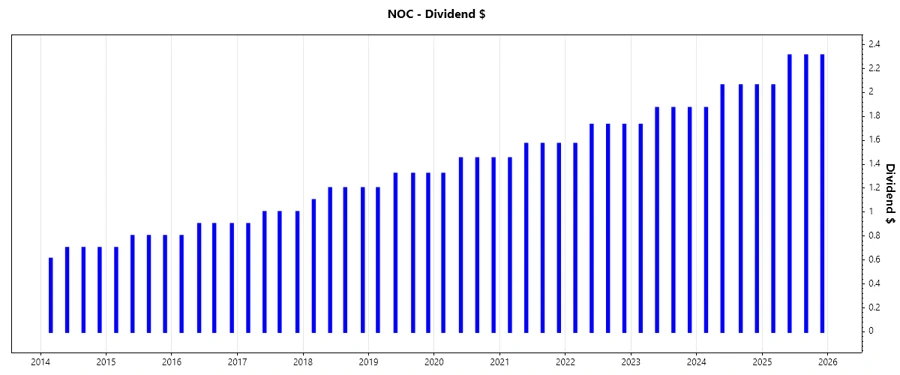
🗣️ Dividend History
The long-standing history of dividend payments highlights Northrop Grumman's commitment to returning value to shareholders. A consistent increase in the annual dividend per share reflects the company's strong financial health and discipline.
| Year | Dividend per Share (USD) |
|---|---|
| 2025 | 8.99 |
| 2024 | 8.05 |
| 2023 | 7.34 |
| 2022 | 6.76 |
| 2021 | 6.16 |
📈 Dividend Growth
Assessing dividend growth offers insights into a company's future profitability and shareholder returns. Northrop Grumman shows consistent growth in its dividend distributions, indicative of its favorable earnings outlook.
| Time | Growth |
|---|---|
| 3 years | 9.97% |
| 5 years | 9.66% |
The average dividend growth is 9.66% over 5 years. This shows moderate but steady dividend growth.
📉 Payout Ratio
The payout ratio is a critical measure of dividend sustainability. Northrop Grumman maintains a healthy balance, ensuring dividends are well covered by earnings and free cash flow.
| Key figure | Ratio |
|---|---|
| EPS-based | 30.79% |
| Free cash flow-based | 38.67% |
The EPS-based payout ratio of 30.79% and FCF-based ratio of 38.67% suggest a conservative approach, enabling sustainable dividend payments.
✅ Cashflow & Capital Efficiency
Cash flow analysis provides insight into financial flexibility and capital allocation efficiency, crucial for maintaining dividend practices and growth investments.
| Metric | 2025 | 2024 | 2023 |
|---|---|---|---|
| Free Cash Flow Yield | 4.04% | 3.80% | 2.96% |
| Earnings Yield | 5.11% | 6.05% | 2.90% |
| CAPEX to Operating Cash Flow | 30.48% | 40.27% | 45.81% |
| Stock-based Compensation to Revenue | 0.28% | 0.25% | 0.22% |
| Free Cash Flow / Operating Cash Flow Ratio | 69.52% | 59.73% | 54.19% |
The data highlights strong cash flow management with efficient capital allocation, sustaining dividend reliability and growth potential.
⚠️ Balance Sheet & Leverage Analysis
A comprehensive balance sheet analysis reveals the company's leverage dynamics, offering insights into risk levels and financial security.
| Metric | 2025 | 2024 | 2023 |
|---|---|---|---|
| Debt-to-Equity | 0.11 | 1.20 | 1.08 |
| Debt-to-Assets | 0.04 | 0.37 | 0.34 |
| Debt-to-Capital | 0.10 | 0.55 | 0.52 |
| Net Debt to EBITDA | -0.56 | 2.05 | 3.06 |
| Current Ratio | 1.10 | 1.01 | 1.15 |
| Quick Ratio | 1.10 | 0.91 | 1.05 |
| Financial Leverage | 3.08 | 3.23 | 3.15 |
The balance sheet indicates balanced leverage with sound financial stability, reflecting Northrop Grumman's careful risk management approach.
📏 Fundamental Strength & Profitability
Analyzing the company's profitability and fundamental strengths provides insights into its operational efficiency and market standing.
| Metric | 2025 | 2024 | 2023 |
|---|---|---|---|
| Return on Equity | 25.08% | 27.30% | 13.90% |
| Return on Assets | 8.14% | 8.46% | 4.41% |
| Margins: Net | 9.97% | 10.17% | 5.23% |
| EBIT | - | 13.33% | 7.36% |
| EBITDA | 10.75% | 16.67% | 10.76% |
| Gross | - | 20.38% | 16.67% |
| Research & Development to Revenue | 0% | 2.68% | 3.05% |
The robust profitability metrics signify efficient operations and a strong competitive position in the market.
Price Development
✅ Dividend Scoring System
| Criterion | Score | |
|---|---|---|
| Dividend yield | 3 | |
| Dividend Stability | 5 | |
| Dividend growth | 4 | |
| Payout ratio | 4 | |
| Financial stability | 4 | |
| Dividend continuity | 5 | |
| Cashflow Coverage | 3 | |
| Balance Sheet Quality | 4 |
Total Score: 32/40
🏆 Rating
Northrop Grumman Corporation demonstrates strong dividend fundamentals characterized by a sustainable payout ratio, stable cash flow coverage, and reliable growth trajectories. The company's strategic discipline and robust balance sheet make it a favorable candidate for dividend-centric portfolios.
Smart Data Insight
Master the Perfect Entry & Exit for this Stock
Don't leave your profits to chance. Historically, this stock follows specific seasonal patterns that institutional traders use to maximize returns.
- ✅ Identify the "Golden Buying Window"
- ✅ Avoid high-risk correction cycles
- ✅ Backtested data from the last 20+ years