October 25, 2025 a 02:47 am
NOC: Dividend Analysis - Northrop Grumman Corporation
Northrop Grumman Corporation demonstrates robust dividend performance characterized by its consistent payout and impressive track record of dividend history. Despite a modest current yield, the firm's long-term commitment to dividend growth offers promising potential for income-oriented investors. Moreover, its strong balance sheet and capital efficiency further underline its solid position in the defense sector.
📊 Overview
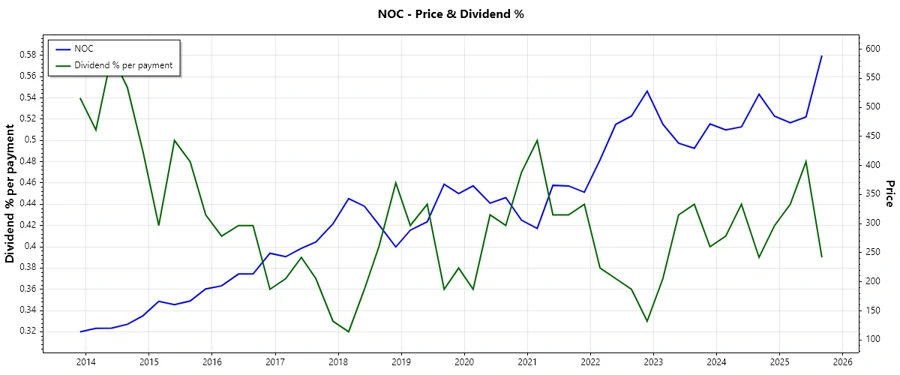
Northrop Grumman operates within the complex and high-demand defense sector, boasting a reliable dividend yield. Despite a modest yield of 1.48%, the company's 44-year dividend history without recent cuts underscores a stable commitment to its shareholders.
| Metric | Value |
|---|---|
| Sector | Defense |
| Dividend yield | 1.48% |
| Current dividend per share | 8.07 USD |
| Dividend history | 44 years |
| Last cut or suspension | None |
🗣️ Dividend History
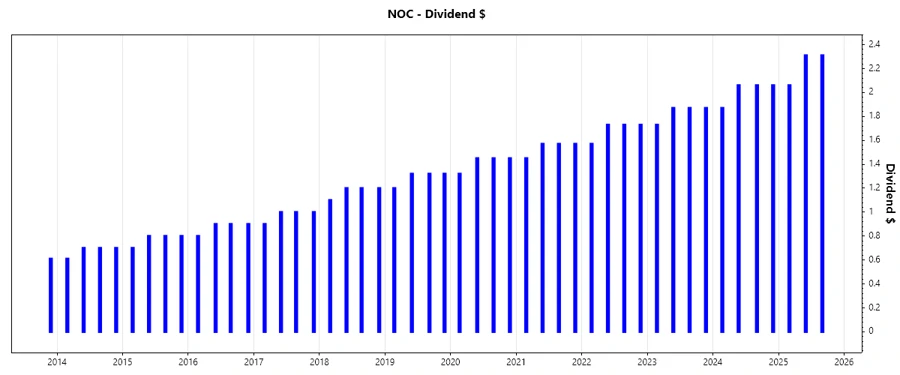
With a remarkable 44 years of uninterrupted dividend history, Northrop Grumman exemplifies reliability and investor trust. The historical dividend payments reflect a consistent upward trajectory, indicative of a firm managed for growth and stability.
| Year | Dividend per Share (USD) |
|---|---|
| 2025 | 6.68 |
| 2024 | 8.05 |
| 2023 | 7.34 |
| 2022 | 6.76 |
| 2021 | 6.16 |
📈 Dividend Growth
Analyzing the dividend growth periods, Northrop Grumman records a 9.3% growth over the past 5 years, with sustained compound annual growth over the past 3 years. Such growth patterns reassure shareholders of the company's commitment to enhancing shareholder value over time.
| Time | Growth |
|---|---|
| 3 years | 9.33% |
| 5 years | 9.30% |
The average dividend growth is 9.30% over 5 years. This shows moderate but steady dividend growth.
📉 Payout Ratio
The payout ratios provide insight into the sustainability of dividends. Northrop Grumman's earnings-based ratio stands at 28.73%, while the free cash flow payout ratio is relatively higher at 62.79%. This balance suggests that the company maintains a cautious approach to dividend distribution, safeguarding future payouts against earnings volatility.
| Key Figure | Ratio |
|---|---|
| EPS-based | 28.73% |
| Free cash flow-based | 62.79% |
The payout based on EPS is quite conservative at 28.73%, reflecting prudent dividend policy, while the higher 62.79% FCF-based payout underscores the present strain on cash flow allocation.
✅ Cashflow & Capital Efficiency
Cash flow and capital efficiency metrics are pivotal in assessing Northrop Grumman's operational capability. The consistent free cash flow yield and a moderate earnings yield indicate efficient capital utilization, important in the capital-intensive defense sector.
| Year | 2024 | 2023 | 2022 |
|---|---|---|---|
| Free Cash Flow Yield | 3.80% | 2.96% | 1.73% |
| Earnings Yield | 6.05% | 2.90% | 5.79% |
| CAPEX to Operating Cash Flow | 40.27% | 45.81% | 49.47% |
| Stock-based Compensation to Revenue | 0.25% | 0.22% | 0.27% |
| Free Cash Flow / Operating Cash Flow Ratio | 59.73% | 54.19% | 50.53% |
Northrop Grumman showcases adept cash flow management, with an impressive Free Cash Flow Yield reflective of solid operational performance.
⚠️ Balance Sheet & Leverage Analysis
Northrop Grumman's financial standing is fortified by relatively balanced leverage ratios, indicative of a sound capital structure. The company maintains favorable liquidity ratios, ensuring financial flexibility.
| Year | 2024 | 2023 | 2022 |
|---|---|---|---|
| Debt-to-Equity | 1.20 | 1.08 | 0.98 |
| Debt-to-Assets | 0.37 | 0.34 | 0.34 |
| Debt-to-Capital | 0.55 | 0.52 | 0.49 |
| Net Debt to EBITDA | 2.05 | 3.06 | 1.62 |
| Current Ratio | 1.01 | 1.15 | 1.08 |
| Quick Ratio | 0.91 | 1.05 | 0.99 |
| Financial Leverage | 3.23 | 3.15 | 2.86 |
The company's leverage profile and liquidity position suggest robust financial stability, with leverage used judiciously to bolster growth.
✅ Fundamental Strength & Profitability
Key profitability metrics at Northrop Grumman exhibit strong returns on equity and assets, corroborating its effective deployment of capital and excellence in operational execution.
| Year | 2024 | 2023 | 2022 |
|---|---|---|---|
| Return on Equity | 27.30% | 13.90% | 31.97% |
| Return on Assets | 8.46% | 4.42% | 11.19% |
| Margins | Net: 10.17%, EBIT: 13.33% | Net: 5.23%, EBIT: 7.35% | Net: 13.38%, EBIT: 17.33% |
| R&D to Revenue | 2.68% | 3.05% | 3.28% |
Northrop Grumman's impressive fundamentals underscore its high profitability and strong emphasis on R&D investment to foster long-term growth.
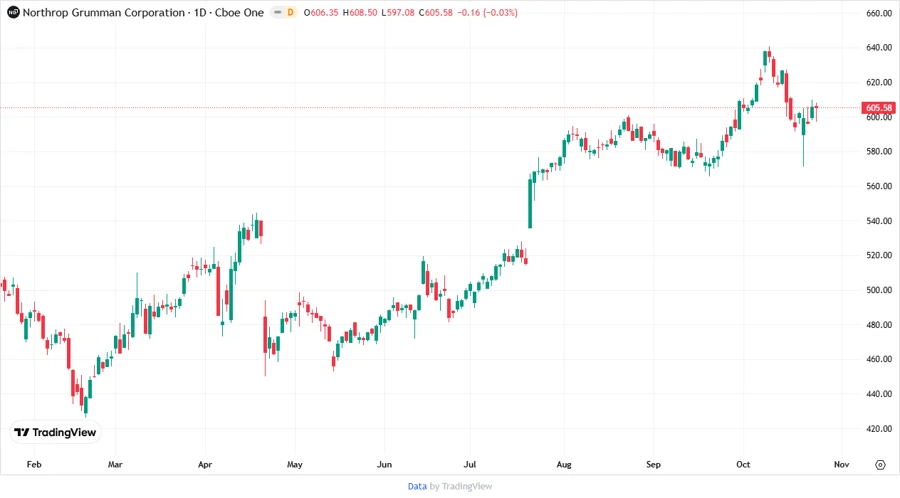
📊 Price Development
🔍 Dividend Scoring System
| Criteria | Description | Score |
|---|---|---|
| Dividend yield | 1.48% yield, moderate | 3/5 |
| Dividend Stability | 44 years without cuts | 5/5 |
| Dividend growth | 9.30% over 5 years | 4/5 |
| Payout ratio | Balanced policy | 4/5 |
| Financial stability | Strong balance sheet | 5/5 |
| Dividend continuity | Consistent history | 5/5 |
| Cashflow Coverage | Good FCF management | 3/5 |
| Balance Sheet Quality | Managed leverage | 4/5 |
Overall Score: 33/40
🔍 Rating
Northrop Grumman Corporation is strongly positioned within its sector, with a proven track record of rewarding shareholders through consistent dividends and financial prudence. Suitable for those seeking steady, long-term dividend income complemented by moderate growth potential.
Smart Data Insight
Master the Perfect Entry & Exit for this Stock
Don't leave your profits to chance. Historically, this stock follows specific seasonal patterns that institutional traders use to maximize returns.
- ✅ Identify the "Golden Buying Window"
- ✅ Avoid high-risk correction cycles
- ✅ Backtested data from the last 20+ years