May 27, 2025 a 07:46 am

NOC: Dividend Analysis - Northrop Grumman Corporation
Northrop Grumman Corporation presents a robust dividend profile with a stable dividend history spanning 44 years, indicating strong commitment to shareholder returns. Despite a moderate dividend yield of 1.80%, the company's long-term growth and consistent dividend payouts make it a worthy consideration for income-oriented investors. With no recent cuts or suspensions, Northrop Grumman shows resilience in managing its capital efficiently.
📊 Overview
| Metric | Details |
|---|---|
| Sector | Aerospace & Defense |
| Dividend Yield | 1.80 % |
| Current Dividend per Share | $8.07 USD |
| Dividend History | 44 years |
| Last Cut or Suspension | None |
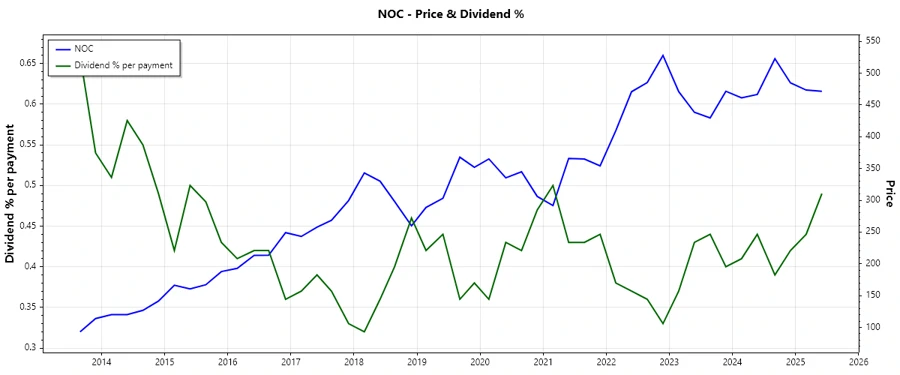
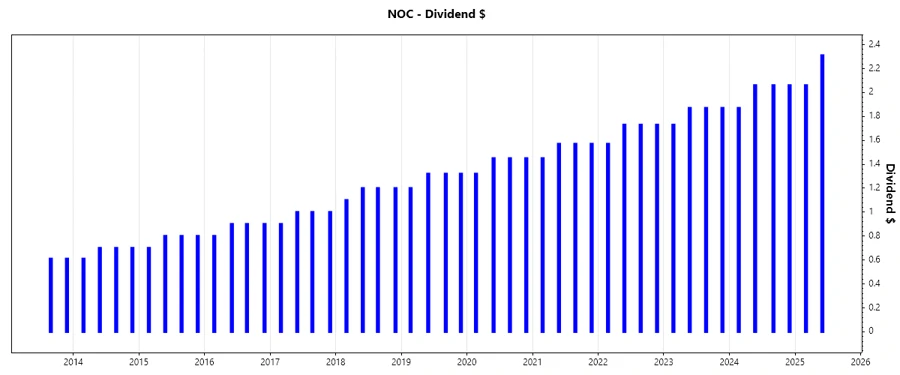
🗣️ Dividend History
Northrop Grumman Corporation boasts an impressive history of dividend payments, reflecting the company's financial stability and commitment to its investors. Analyzing this history provides insights into the company's ability to maintain and potentially grow its dividends over time.
| Year | Dividend per Share (USD) |
|---|---|
| 2025 | 4.37 |
| 2024 | 8.05 |
| 2023 | 7.34 |
| 2022 | 6.76 |
| 2021 | 6.16 |
📈 Dividend Growth
Monitoring dividend growth is crucial as it signals the company's potential to increase shareholder value over time. Northrop Grumman's dividend growth has been consistent, indicating a positive outlook for future dividend increases and the company's overall financial health.
| Time | Growth |
|---|---|
| 3 years | 9.33 % |
| 5 years | 9.30 % |
The average dividend growth is 9.30% over 5 years. This shows moderate but steady dividend growth.
⚠️ Payout Ratio
The payout ratio is essential for evaluating the sustainability of dividend payments. Analyzing both EPS-based and Free Cash Flow-based payout ratios provides comprehensive insights into the company's ability to cover its dividend commitments.
| Key Figure | Ratio |
|---|---|
| EPS-based | 31.44 % |
| Free cash flow-based | 65.38 % |
An EPS payout ratio of 31.44% suggests a comfortable margin, allowing room for further dividends or reinvestments. However, a FCF payout ratio of 65.38% indicates higher relative pressure on cash flows.
✅ Cashflow & Capital Efficiency
Evaluating cash flow and capital efficiency metrics are vital in understanding a company's financial health and operational effectiveness. These metrics highlight the ability to generate cash flow and utilize capital efficiently for growth or to pay dividends.
| Metric | 2024 | 2023 | 2022 |
|---|---|---|---|
| Free Cash Flow Yield | 3.80 % | 2.96 % | 1.73 % |
| Earnings Yield | 6.05 % | 2.90 % | 5.79 % |
| CAPEX to Operating Cash Flow | 40.27 % | 45.81 % | 49.47 % |
| Stock-based Compensation to Revenue | 0.25 % | 0.22 % | 0.27 % |
| Free Cash Flow / Operating Cash Flow Ratio | 59.72 % | 54.19 % | 50.53 % |
The company's high free cash flow yield and controlled CAPEX suggest efficient cash management and capital allocation strategies, supporting dividend sustainability.
📉 Balance Sheet & Leverage Analysis
A strong balance sheet is key to ensuring financial stability, a crucial factor for sustainable dividend payments. Leverage ratios shed light on the level of debt and financial flexibility of the company.
| Metric | 2024 | 2023 | 2022 |
|---|---|---|---|
| Debt-to-Equity | 1.08 | 1.06 | 0.96 |
| Debt-to-Assets | 0.33 | 0.34 | 0.34 |
| Debt-to-Capital | 0.52 | 0.51 | 0.49 |
| Net Debt to EBITDA | 1.73 | 2.97 | 1.58 |
| Current Ratio | 1.01 | 1.15 | 1.08 |
| Quick Ratio | 1.01 | 1.05 | 0.99 |
| Financial Leverage | 3.23 | 3.15 | 2.86 |
Northrop Grumman's debt metrics are manageable, suggesting a balanced approach to leverage, providing a solid foundation for consistent dividend payments despite market fluctuations.
💪 Fundamental Strength & Profitability
Profitability ratios are critical for assessing a company's operational efficiency and ability to generate profits. These figures help in understanding how well the company is performing relative to its peers and maintaining its dividend commitment.
| Metric | 2024 | 2023 | 2022 |
|---|---|---|---|
| Return on Equity | 27.30 % | 13.90 % | 31.97 % |
| Return on Assets | 8.46 % | 4.42 % | 11.19 % |
| Return on Invested Capital | 10.32 % | 6.43 % | 15.86 % |
| Net Margin | 10.17 % | 5.23 % | 13.38 % |
| EBIT Margin | 13.74 % | 7.36 % | 17.33 % |
| EBITDA Margin | 17.08 % | 10.76 % | 20.99 % |
| Gross Margin | 20.38 % | 16.67 % | 20.42 % |
The profitability indicators reflect Northrop Grumman's operational efficiency and ability to sustain its dividend payments, backed by robust return metrics even during economic uncertainties.
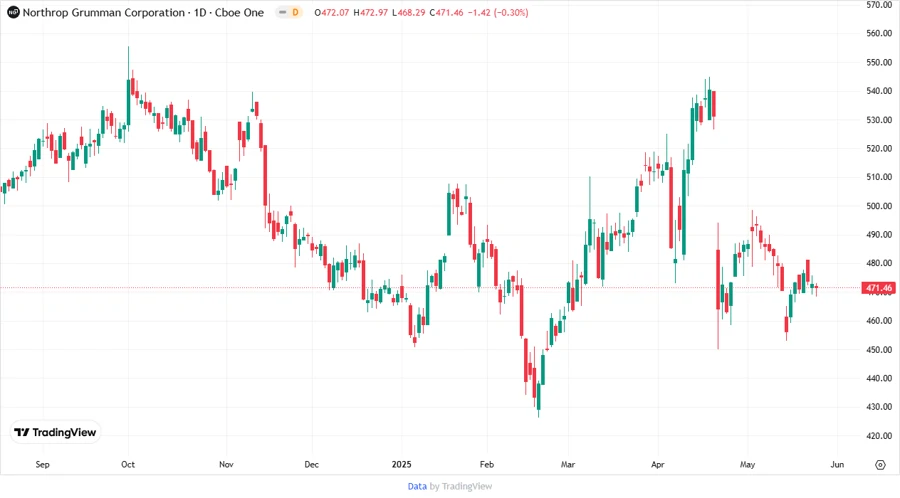
📈 Price Development
🎯 Dividend Scoring System
| Criteria | Score | Score Bar |
|---|---|---|
| Dividend Yield | 4 | |
| Dividend Stability | 5 | |
| Dividend Growth | 4 | |
| Payout Ratio | 4 | |
| Financial Stability | 5 | |
| Dividend Continuity | 5 | |
| Cashflow Coverage | 4 | |
| Balance Sheet Quality | 5 |
Total Score: 36/40
⭐ Rating
Northrop Grumman Corporation is a highly rated stock with a commendable dividend record deeply embedded in strong financial metrics. Given its consistent dividend growth, historical reliability, and sound financial position, Northrop Grumman exemplifies an attractive opportunity for dividend investors looking for stability and moderate growth potential. Consider this stock for a balanced income-oriented portfolio.
Smart Data Insight
Master the Perfect Entry & Exit for this Stock
Don't leave your profits to chance. Historically, this stock follows specific seasonal patterns that institutional traders use to maximize returns.
- ✅ Identify the "Golden Buying Window"
- ✅ Avoid high-risk correction cycles
- ✅ Backtested data from the last 20+ years