September 28, 2025 a 09:03 am
NKE: Trend and Support & Resistance Analysis - NIKE, Inc.
NIKE, Inc., a leader in athletic footwear and apparel, exhibits a stock performance marked by periods of volatility yet consistent growth over the long term. Technical analysis of recent price data suggests specific trends and zones, providing insights into potential future movements. Traders and investors might find opportunities in identifying support and resistance zones as these may indicate key points for potential reversals or continuation of trends.
Trend Analysis
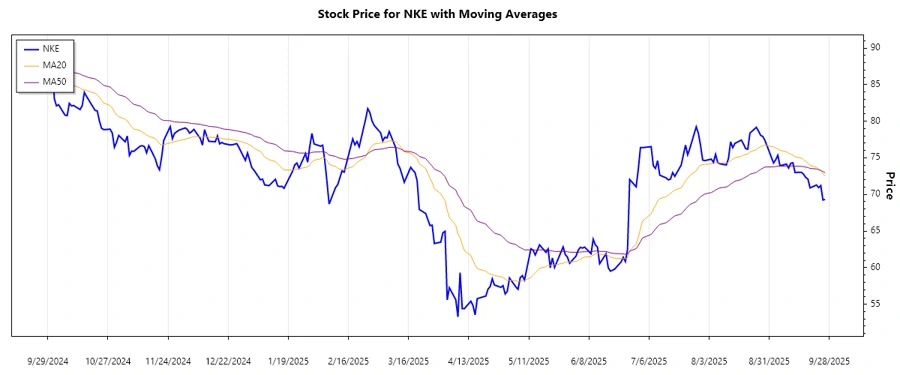
Examining the stock trends based on the closing prices, the following insights have been drawn. By calculating the Exponential Moving Averages (EMA) over the past 20 and 50 days, a significant trend distinction can be identified. The EMA20 is currently below the EMA50, indicating a prevailing ▼ downtrend. This suggests market bearishness, with short-term pressures outweighing the longer-term outlook.
| Date | Closing Price | Trend |
|---|---|---|
| 2025-09-26 | 69.31 | ▼ |
| 2025-09-25 | 69.24 | ▼ |
| 2025-09-24 | 71.22 | ▼ |
| 2025-09-23 | 70.93 | ▼ |
| 2025-09-22 | 71.28 | ▼ |
| 2025-09-19 | 70.89 | ▼ |
| 2025-09-18 | 72.10 | ▼ |
The current downward trajectory indicates selling pressure, suggesting that a bearish market sentiment is prominent.
Support and Resistance
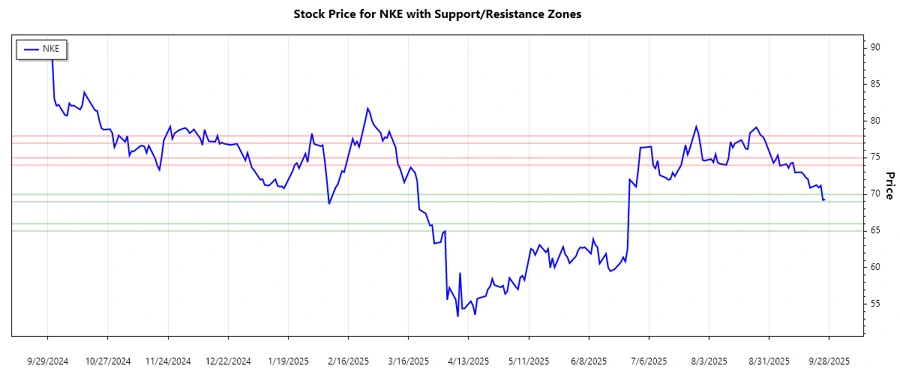
Based on the analysis of recent closing prices, critical support and resistance zones have been observed. The support zones are placed around historical low price levels where downward movements may halt, while resistance zones mark historical highs where upward movements may reverse.
| Zone Type | From | To |
|---|---|---|
| Support Zone 1 | 69.00 | 70.00 |
| Support Zone 2 | 65.00 | 66.00 |
| Resistance Zone 1 | 74.00 | 75.00 |
| Resistance Zone 2 | 77.00 | 78.00 |
Currently, the stock price is situated within the first support zone, potentially indicating a level of price stabilization.
Conclusion
In conclusion, NIKE, Inc.'s stock seems to be facing downward pressures in the short term as indicated by the moving averages trend analysis. The stock's position within the lower support zone may serve as a key point for potential reversal, posing both risks and opportunities for investors. Market participants should remain vigilant of these zones as potential indicators of future movement. Technical analysis highlights the necessity of monitoring for any breaches in these zones, which could herald significant changes in trend direction.
Smart Data Insight
Master the Perfect Entry & Exit for this Stock
Don't leave your profits to chance. Historically, this stock follows specific seasonal patterns that institutional traders use to maximize returns.
- ✅ Identify the "Golden Buying Window"
- ✅ Avoid high-risk correction cycles
- ✅ Backtested data from the last 20+ years