December 05, 2025 a 06:44 am

NKE: Fibonacci Analysis - NIKE, Inc.
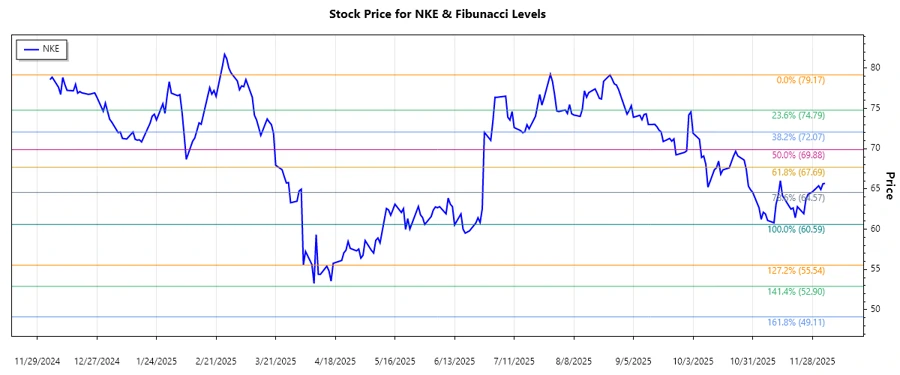
NIKE, Inc., a leader in athletic apparel and footwear, has shown historical volatility tied to both economic trends and consumer preferences. Recent data indicate a downward trend after a period of growth, suggesting potential retracement opportunities for technical analysts. Fibunacci analysis provides insight into potential support and resistance levels critical for strategic decision-making.
Fibonacci Analysis
| Start Date | End Date | High Price & Date | Low Price & Date | Fibonacci Levels | Current Price | Retracement Zone | Technical Interpretation | ||||||||||||
|---|---|---|---|---|---|---|---|---|---|---|---|---|---|---|---|---|---|---|---|
| 2025-08-25 | 2025-12-04 | $79.17 on 2025-08-25 | $60.59 on 2025-05-30 |
|
65.69 | 0.618 | The current price is within the 0.618 retracement zone, indicating a potential support level. |
Conclusion
NIKE, Inc.'s stock is currently experiencing a retracement within the identified downward trend, offering a potential support at the 0.618 Fibonacci level of $66.37. As the company faces challenges related to global market dynamics and evolving consumer preferences, these levels provide critical insights for potential reversal points. However, risks associated with broader economic conditions and competitive pressures remain. Analysts should consider these factors alongside technical insights for updated strategic decisions.