
May 31, 2026 a 07:46 am

NKE: Dividend Analysis - NIKE, Inc.
NIKE, Inc. stands out as a stalwart in the athletic apparel industry, boasting a robust track record of steady dividend payouts and growth. This comprehensive analysis delves into NIKE's dividend profile, assessing its payout history, growth trajectory, and financial fundamentals. With its substantial market presence and strategic financial management, NIKE demonstrates potential for continued shareholder value enhancement through dividends, despite certain pressures expressed in its payout ratios.
📊 Overview
NIKE operates within the Consumer Discretionary sector, presenting an attractive dividend yield of 3.53%. With a consistently growing dividend history spanning 41 years, the company has not recorded any recent cuts or suspensions — a testament to its fiscal diligence and strategic prowess.
| Metric | Value |
|---|---|
| Sector | Consumer Discretionary |
| Dividend yield | 3.53% |
| Current dividend per share | 1.55 USD |
| Dividend history | 41 years |
| Last cut or suspension | None |
📈 Dividend History
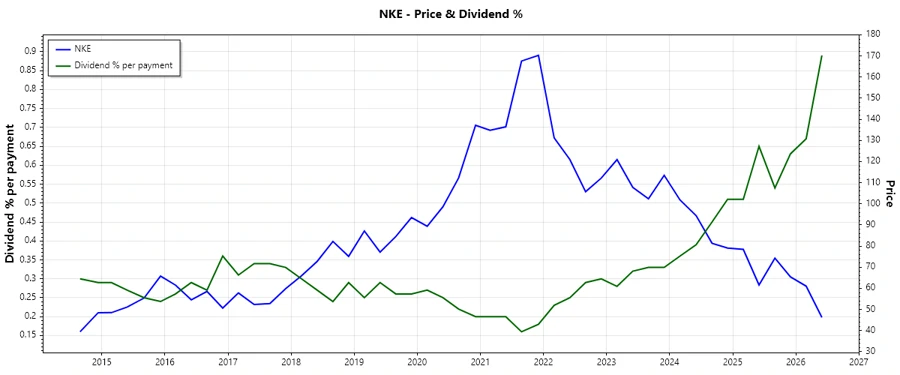
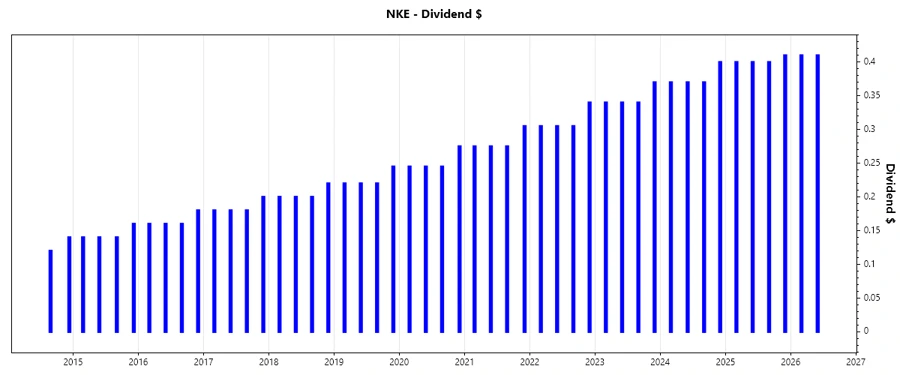
A critical evaluation of NIKE's dividend history reveals a robust track record and unwavering commitment to shareholder returns. This history underscores the importance of NIKE's strategic capital allocation.
| Year | Dividend per share (USD) |
|---|---|
| 2026 | 0.82 |
| 2025 | 1.61 |
| 2024 | 1.51 |
| 2023 | 1.39 |
| 2022 | 1.255 |
📉 Dividend Growth
NIKE exhibits moderate yet consistent dividend growth, reinforcing its resilience in a competitive marketplace. Such growth is pivotal for long-term income potential and capital appreciation.
| Time | Growth |
|---|---|
| 3 years | 8.66% |
| 5 years | 9.77% |
The average dividend growth is 9.77% over 5 years. This shows moderate but steady dividend growth.
⚠️ Payout Ratio
Payout ratios offer insights into the sustainability of dividend payments relative to earnings and cash flows. Currently, NIKE's EPS-based payout ratio exceeds optimal levels, while its free cash flow-based ratio suggests constraints.
| Key figure ratio | Value |
|---|---|
| EPS-based | 101.81% |
| Free cash flow-based | 218.50% |
These figures indicate potential sustainability concerns, with the EPS payout exceeding 100% and the FCF payout ratio significantly high, signaling that dividend payments could constrain future growth investments without adjustments.
✅ Cashflow & Capital Efficiency
Key indicators of cash generation and capital deployment, like Free Cash Flow Yield and CAPEX to Operating Cash Flow, define a company's capability to fund dividends while investing in growth.
| Metric | 2025 | 2024 | 2023 |
|---|---|---|---|
| Free Cash Flow Yield | 3.63% | 4.59% | 2.98% |
| Earnings Yield | 3.58% | 3.95% | 3.10% |
| CAPEX to Operating Cash Flow | 11.63% | 10.93% | 16.59% |
| Stock-based Compensation to Revenue | 1.53% | 1.57% | 1.47% |
| Free Cash Flow / Operating Cash Flow Ratio | 88.37% | 89.07% | 83.41% |
Despite fluctuating cash flows, capital deployment appears efficient with strong earnings yields. However, maintaining this balance is crucial to protect dividends against cyclical downturns.
🗣️ Balance Sheet & Leverage Analysis
Understanding leverage metrics and liquidity ratios helps assess NIKE's ability to meet financial obligations and sustain operational resiliency.
| Metric | 2025 | 2024 | 2023 |
|---|---|---|---|
| Debt-to-Equity | 0.83 | 0.83 | 0.87 |
| Debt-to-Assets | 0.30 | 0.31 | 0.32 |
| Debt-to-Capital | 0.45 | 0.45 | 0.46 |
| Net Debt to EBITDA | 0.78 | 0.29 | 0.69 |
| Current Ratio | 2.21 | 2.40 | 2.72 |
| Quick Ratio | 1.50 | 1.69 | 1.81 |
| Financial Leverage | 2.77 | 2.64 | 2.68 |
NIKE maintains a healthy liquidity profile with moderate leverage, signaling a balanced approach to debt management which underpins its financial stability.
🧐 Fundamental Strength & Profitability
Profitability ratios and return metrics provide a lens into corporate efficiency and competitive strength. NIKE's performance metrics reflect strong profit margins and excellent capital management.
| Metric | 2025 | 2024 | 2023 |
|---|---|---|---|
| Return on Equity | 24.36% | 39.50% | 36.20% |
| Return on Assets | 8.80% | 14.96% | 13.51% |
| Margins: Net | 6.95% | 11.10% | 9.90% |
| Margins: EBIT | 7.99% | 12.29% | 11.55% |
| Margins: EBITDA | 9.74% | 13.93% | 13.23% |
| Margins: Gross | 42.73% | 44.56% | 43.52% |
| Research & Development to Revenue | 0% | 0% | 0% |
NIKE exhibits strong equity returns driven by effective capital deployment, supported by robust margins. Its profitability affirms NIKE's status as a market leader.
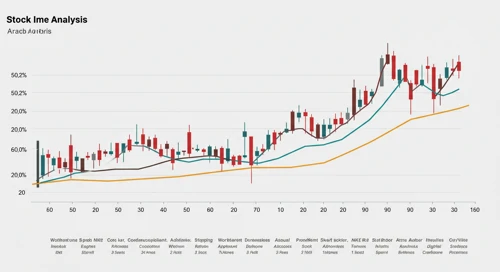
📉 Price Development
🌟 Dividend Scoring System
| Criteria | Score | Scale |
|---|---|---|
| Dividend yield | 4 | |
| Dividend Stability | 5 | |
| Dividend growth | 3 | |
| Payout ratio | 2 | |
| Financial stability | 4 | |
| Dividend continuity | 5 | |
| Cashflow Coverage | 3 | |
| Balance Sheet Quality | 4 |
Total Score: 30/40
🔍 Rating
NIKE, Inc.'s dividend profile showcases a well-established commitment to shareholder returns, underscored by historical stability and consistent growth. While elevated payout ratios suggest caution, NIKE's capacity to innovate and scale operationally provides confidence in its future dividend sustainability. Investors are advised to consider NIKE a solid dividend choice, with moderate growth expectations entailing a balance between yield and capital appreciation.
Smart Data Insight
Master the Perfect Entry & Exit for this Stock
Don't leave your profits to chance. Historically, this stock follows specific seasonal patterns that institutional traders use to maximize returns.
- ✅ Identify the "Golden Buying Window"
- ✅ Avoid high-risk correction cycles
- ✅ Backtested data from the last 20+ years