August 20, 2025 a 07:31 am

NKE: Dividend Analysis - NIKE, Inc.
NIKE, Inc. has demonstrated a robust dividend payment history over four decades, showcasing its commitment to returning capital to shareholders. The current dividend yield of 2.08% is in line with industry standards, offering investors a stable income stream. Despite a relatively high payout ratio, NIKE's financial stability and continuous growth make it an appealing option for dividend-focused investors.
📊 Overview
NIKE operates in the Consumer Goods sector, characterized by a mix of stability and competitive dynamics. Its dividend profile, with a yield of 2.08% and a 40-year history of payments without a cut, marks it as a solid dividend payer. The absence of recent cuts or suspensions highlights its resilient performance.
| Metric | Value |
|---|---|
| Sector | Consumer Goods |
| Dividend yield | 2.08% |
| Current dividend per share | 1.55 USD |
| Dividend history | 40 years |
| Last cut or suspension | None |
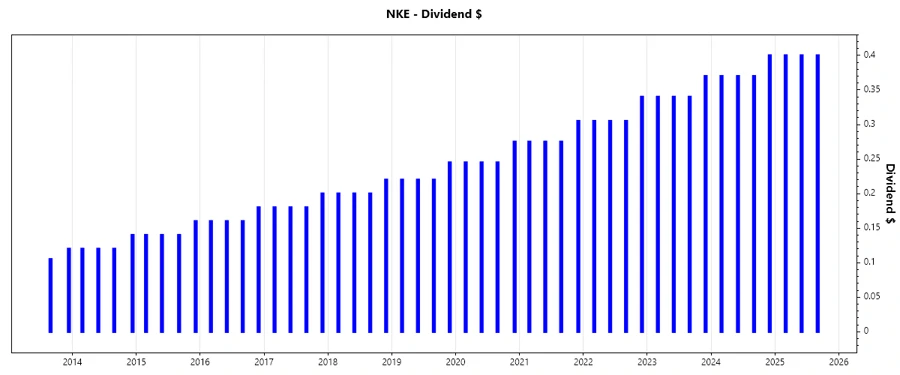
📉 Dividend History
Consistent dividend payments have been a hallmark of NIKE's financial strategy, offering reassurance to income-focused investors. Such a history is crucial for assessing a company's commitment to shareholder returns.
| Year | Dividend per Share (USD) |
|---|---|
| 2025 | 1.20 |
| 2024 | 1.51 |
| 2023 | 1.39 |
| 2022 | 1.255 |
| 2021 | 1.13 |
📈 Dividend Growth
Analyzing dividend growth provides insights into a company's future ability to increase payouts, reflecting financial health and management confidence. NIKE's growth rates highlight a strong commitment to enhancing shareholder value over time.
| Time | Growth |
|---|---|
| 3 years | 10.15% |
| 5 years | 10.78% |
The average dividend growth is 10.78% over 5 years. This shows moderate but steady dividend growth.
🗣️ Payout Ratio
The payout ratio is indicative of how much profit is returned to shareholders versus retained for growth. A high payout ratio might raise flags about sustainability, but NIKE's historical growth supports the current levels.
| Key figure ratio | Value |
|---|---|
| EPS-based | 71.06% |
| Free cash flow-based | 70.00% |
The EPS payout ratio at 71.06% suggests a high commitment to dividends, albeit with caution needed for future growth. The FCF ratio's parallel level indicates solid cash flow management supporting dividend payouts.
✅ Cashflow & Capital Efficiency
Cash flow metrics are critical in assessing a firm's ability to cover dividends and invest for growth. NIKE's stable cash conversion and judicious use of free cash flow underscore effective capital efficiency.
| Metric | 2023 | 2024 | 2025 |
|---|---|---|---|
| Free Cash Flow Yield | 2.98% | 4.59% | 3.63% |
| Earnings Yield | 3.10% | 3.95% | 3.58% |
| CAPEX to Operating Cash Flow | 16.59% | 10.93% | 11.63% |
| Stock-based Compensation to Revenue | 1.47% | 1.56% | 1.53% |
| Free Cash Flow / Operating Cash Flow Ratio | 83.41% | 89.07% | 88.37% |
NIKE's robust cash generation and prudent capital spending facilitate strong and sustainable dividend coverage, reinforcing financial health.
🗣️ Balance Sheet & Leverage Analysis
Balance sheet strength and leverage ratios are vital for understanding long-term financial stability and risk exposure. NIKE's metrics reflect a solid position with manageable leverage.
| Measure | 2023 | 2024 | 2025 |
|---|---|---|---|
| Debt-to-Equity | 86.72% | 82.83% | 83.39% |
| Debt-to-Assets | 32.36% | 31.36% | 30.12% |
| Debt-to-Capital | 46.44% | 45.30% | 45.47% |
| Net Debt to EBITDA | 65.44% | 26.97% | 91.48% |
| Current Ratio | 2.72 | 2.40 | N/A |
| Quick Ratio | 1.81 | 1.69 | 1.50 |
| Financial Leverage | 2.68 | 2.64 | 2.77 |
NIKE's judicious debt management and strong liquidity position reinforce its ability to withstand market fluctuations and ensures operational stability.
✅ Fundamental Strength & Profitability
Grasping fundamental metrics like return on equity and profit margins is key to gauging a company's overall efficiency and profitability. NIKE's metrics reflect solid management and operational effectiveness.
| Metric | 2023 | 2024 | 2025 |
|---|---|---|---|
| Return on Equity | 36.20% | 39.50% | 24.36% |
| Return on Assets | 13.51% | 14.96% | 8.80% |
| Net Margin | 9.90% | 11.09% | 6.95% |
| EBIT Margin | 12.67% | 13.55% | 8.39% |
| EBITDA Margin | 14.04% | 15.10% | 8.39% |
| Gross Margin | 42.36% | 44.01% | 42.73% |
| R&D to Revenue | 0.00% | 0.00% | 0.00% |
NIKE's commitment to maintaining competitive margins and capitalizing on operational strengths results in robust profitability metrics, underpinning long-term growth potential.
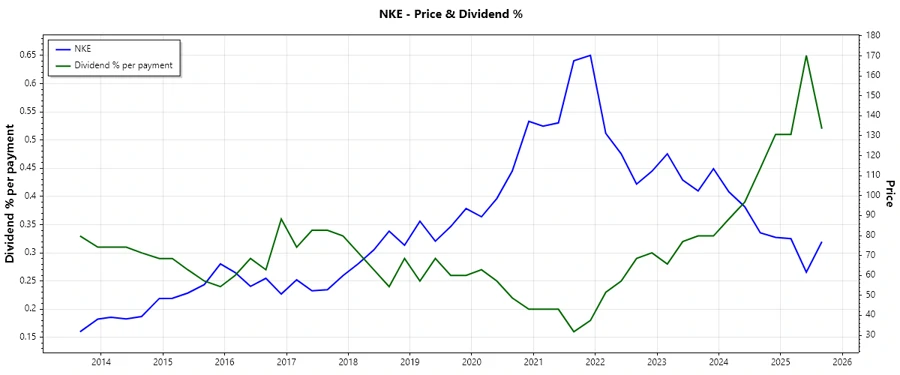
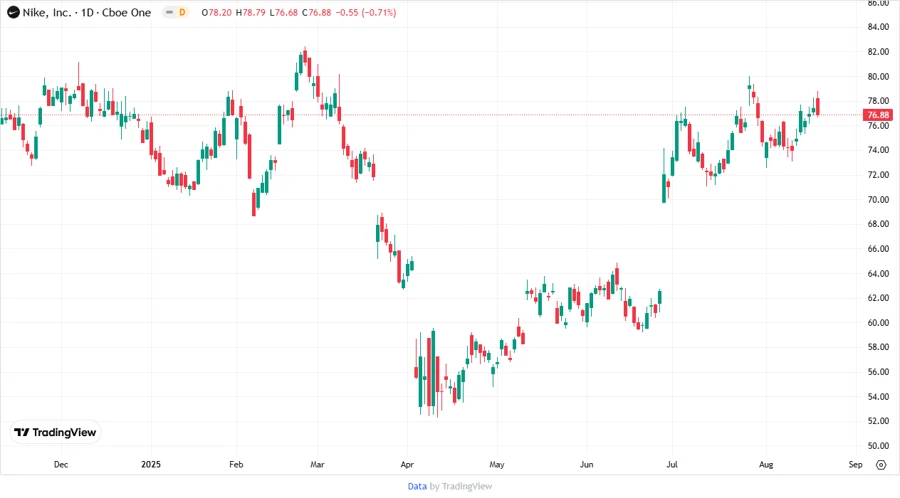
🔍 Price Development
📊 Dividend Scoring System
| Criteria | Score | Indicator |
|---|---|---|
| Dividend yield | 4 | |
| Dividend Stability | 5 | |
| Dividend growth | 4 | |
| Payout ratio | 3 | |
| Financial stability | 5 | |
| Dividend continuity | 5 | |
| Cashflow Coverage | 4 | |
| Balance Sheet Quality | 4 |
Total Score: 34/40
📈 Rating
NIKE, Inc. presents a compelling investment opportunity within the dividend-paying universe. Its combination of a reliable dividend history, moderate growth, and solid financials warrants a strong Buy recommendation for income-focused portfolios seeking stability and long-term growth potential.
Smart Data Insight
Master the Perfect Entry & Exit for this Stock
Don't leave your profits to chance. Historically, this stock follows specific seasonal patterns that institutional traders use to maximize returns.
- ✅ Identify the "Golden Buying Window"
- ✅ Avoid high-risk correction cycles
- ✅ Backtested data from the last 20+ years