July 03, 2025 a 03:31 am


NKE: Dividend Analysis - NIKE, Inc.
NIKE, Inc. presents a compelling dividend profile characterized by stable and consistent payouts over the past decades. The company's enduring history of dividend payments combined with moderate growth rates exemplifies its financial resilience. However, investors should remain mindful of indicators such as payout ratios and cash flow efficiency, which might impact future payout capabilities.
📊 Overview
NIKE, Inc. operates within the highly competitive consumer goods sector and maintains a dividend yield of 2.55%. With a current dividend per share at 1.54 USD and an impressive 40-year dividend history, NIKE has never needed to cut or suspend its dividends, highlighting its robust financial performance.
| Sector | Dividend Yield (%) | Current Dividend per Share (USD) | Dividend History (Years) | Last Cut or Suspension |
|---|---|---|---|---|
| Consumer Goods | 2.55% | 1.54 | 40 | None |
🗣️ Dividend History
Understanding the dividend history is critical to assess the sustainability and reliability of NIKE's payouts. Over the years, NIKE has steadily increased its dividend payments, demonstrating financial stability and commitment to returning capital to shareholders.
| Year | Dividend per Share (USD) |
|---|---|
| 2025 | 0.80 |
| 2024 | 1.51 |
| 2023 | 1.39 |
| 2022 | 1.255 |
| 2021 | 1.130 |
📈 Dividend Growth
The dividend growth metrics provide insights into the potential for future income increases. NIKE's growth rates over 3 and 5 years emphasize moderate, steady growth, reinforcing its reputation as a reliable dividend payer.
| Time | Growth (%) |
|---|---|
| 3 years | 10.15% |
| 5 years | 10.78% |
The average dividend growth is 10.78% over 5 years. This shows moderate but steady dividend growth.
💹 Payout Ratio
The payout ratio metric reveals how much of the earnings are distributed as dividends. NIKE's EPS-based payout ratio of 70.65% indicates a high proportion of earnings being distributed, while the FCF-based ratio of 42.80% shows reasonable management of free cash flows in dividend policies.
| Key figure | Ratio (%) |
|---|---|
| EPS-based | 70.65% |
| Free cash flow-based | 42.80% |
The EPS-based payout ratio of 70.65% suggests that a large portion of earnings is being allocated, possibly limiting flexibility for further dividend growth.
🔍 Cashflow & Capital Efficiency
This section evaluates NIKE's ability to maintain financial health through efficient cash flow management and capital returns. Monitoring these metrics helps predict the company's capability to sustain dividends and support growth activities.
| Year | Free Cash Flow Yield | Earnings Yield | CAPEX to Operating Cash Flow | Stock-based Compensation to Revenue | Free Cash Flow / Operating Cash Flow Ratio |
|---|---|---|---|---|---|
| 2025 | 0% | 3.58% | 0% | 1.58% | 0% |
| 2024 | 4.59% | 3.95% | 10.93% | 1.57% | 89.07% |
| 2023 | 2.98% | 3.10% | 16.59% | 1.47% | 83.41% |
NIKE's cashflow and capital management efficiency supports its ability to sustain and potentially grow dividends, though headwinds in operational cash flow fractions require monitoring.
📉 Balance Sheet & Leverage Analysis
A strong balance sheet and prudent leverage management are fundamental for long-term dividend sustainability. NIKE's current figures highlight a sound financial position with adequate liquidity to service debts and finance growth initiatives.
| Year | Debt-to-Equity | Debt-to-Assets | Debt-to-Capital | Net Debt to EBITDA | Current Ratio | Quick Ratio | Financial Leverage |
|---|---|---|---|---|---|---|---|
| 2025 | 0.83 | 0.30 | 0.45 | 3.30 | 2.21 | 1.50 | 2.77 |
| 2024 | 0.83 | 0.31 | 0.45 | 0.29 | 2.40 | 1.69 | 2.64 |
| 2023 | 0.87 | 0.32 | 0.46 | 0.69 | 2.72 | 1.81 | 2.68 |
NIKE's balance sheet structure exhibits low leverage levels, indicating a strong ability to meet financial commitments.
💼 Fundamental Strength & Profitability
These metrics underscore NIKE's operational efficacy and profitability, contributing to its ability to sustain long-term dividend payouts.
| Year | Return on Equity | Return on Assets | Net Margin | EBIT Margin | EBITDA Margin | Gross Margin | R&D to Revenue |
|---|---|---|---|---|---|---|---|
| 2025 | 24.36% | 8.80% | 6.95% | 8.39% | 7.99% | 42.73% | 0% |
| 2024 | 39.50% | 14.96% | 11.10% | 12.29% | 13.93% | 44.56% | 0% |
| 2023 | 36.20% | 13.51% | 9.90% | 11.55% | 13.23% | 43.52% | 0% |
NIKE's profitability and return ratios reinforce operational efficiency while maintaining competitive margins across fiscal years.
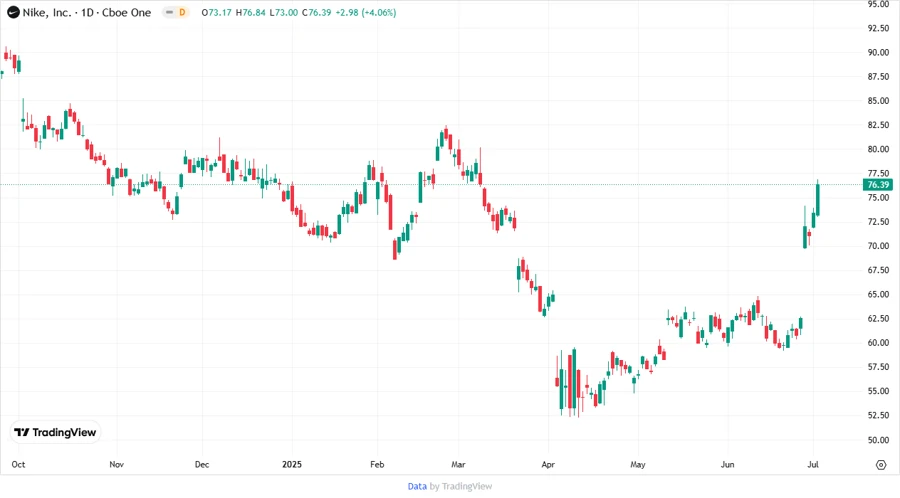
📈 Price Development
✅ Dividend Scoring System
| Category | Score (1-5) | Score Bar |
|---|---|---|
| Dividend Yield | 4 | |
| Dividend Stability | 5 | |
| Dividend Growth | 3 | |
| Payout Ratio | 3 | |
| Financial Stability | 4 | |
| Dividend Continuity | 5 | |
| Cashflow Coverage | 3 | |
| Balance Sheet Quality | 4 |
Overall Score: 31/40
🌟 Rating
NIKE, Inc.'s strong dividend profile, marked by long-term stability and competitive yield, makes it an attractive option for income-focused investors. Although growth rates and payout ratios pose minor considerations, NIKE's robust financial management ensures a solid foundation for continued dividend payments. We recommend a positive outlook.