August 24, 2025 a 04:03 amUm eine umfassende technische Analyse durchzuführen, werde ich die gegebenen Kursdaten verwenden. Bitte warten Sie einen Moment, während ich die Analyse und das HTML-Format für Sie erstelle.
---
### Ergebnis im HTML-Format:
NI: Trend and Support & Resistance Analysis - NiSource Inc.
The recent analysis of NiSource Inc. (Ticker: NI) stock reveals a predominantly bullish trend over the past months. By utilizing closing prices data, we observed a gradual upward movement, indicating investor confidence. However, market fluctuations are present, representing both opportunities and risks within the industry. Investors should monitor these dynamics closely to make informed decisions.
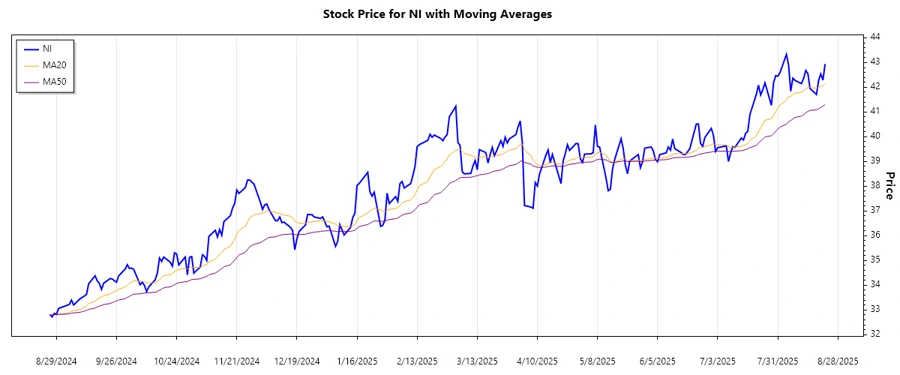
Trend Analysis
The analysis of the closing prices using the exponential moving averages (EMA) has revealed a prevailing uptrend. The EMA20 currently exceeds the EMA50, indicating a favorable market condition for the NiSource Inc. stock.
| Date | Close Price | Trend |
|---|---|---|
| 2025-08-22 | 42.94 | ▲ Uptrend |
| 2025-08-21 | 42.29 | ▲ Uptrend |
| 2025-08-20 | 42.54 | ▲ Uptrend |
| 2025-08-19 | 42.28 | ▲ Uptrend |
| 2025-08-18 | 41.71 | ▲ Uptrend |
| 2025-08-15 | 41.95 | ▲ Uptrend |
| 2025-08-14 | 42.55 | ▲ Uptrend |
Given the current trends, the market has shown persistent strength in the stock, indicating a continuation of the bullish outlook.
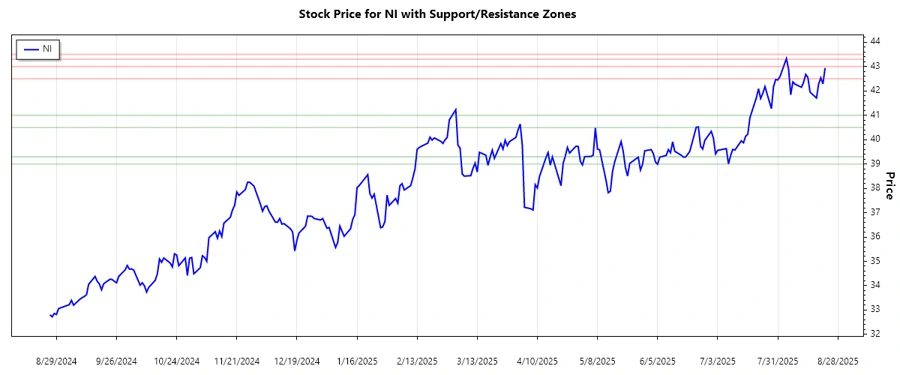
Support- and Resistance
The analysis of the closing prices identifies critical support and resistance zones. These zones help delineate potential areas of price stability and profit-taking or loss cuts.
| Zone Type | From | To |
|---|---|---|
| Support ▲ | 39.00 | 39.30 |
| Support ▲ | 40.50 | 41.00 |
| Resistance ▼ | 42.50 | 43.00 |
| Resistance ▼ | 43.30 | 43.50 |
Currently, the stock price resides in the resistance zone between 42.50 and 43.00. This could imply potential resistance at these levels.
From a technical standpoint, breaking above the resistance zones could signal further upward momentum, while failure to do so might trigger a pullback.
Conclusion
The bullish trend observed in NiSource Inc.'s stock aligns with a broader market uptrend. Support zones indicate key areas for potential rebounds, while the resistance zones highlight potential challenges. Investors should consider these technical indicators alongside fundamental insights. While opportunities for growth are present, inherent risks of market volatility remain. Regular monitoring and strategic adjustments can optimize investment outcomes.
### Ergebnis im JSON-Format: json Diese Analyse bietet eine detaillierte Betrachtung der jüngsten Trends und maßgeblichen Preiszonen der NiSource Inc. Aktie unter Verwendung technischer Indikatoren und transformiert die Daten in ein nutzbares HTML-Format.
Smart Data Insight
Master the Perfect Entry & Exit for this Stock
Don't leave your profits to chance. Historically, this stock follows specific seasonal patterns that institutional traders use to maximize returns.
- ✅ Identify the "Golden Buying Window"
- ✅ Avoid high-risk correction cycles
- ✅ Backtested data from the last 20+ years