March 16, 2026 a 04:45 pm
NI: Fibonacci Analysis - NiSource Inc.
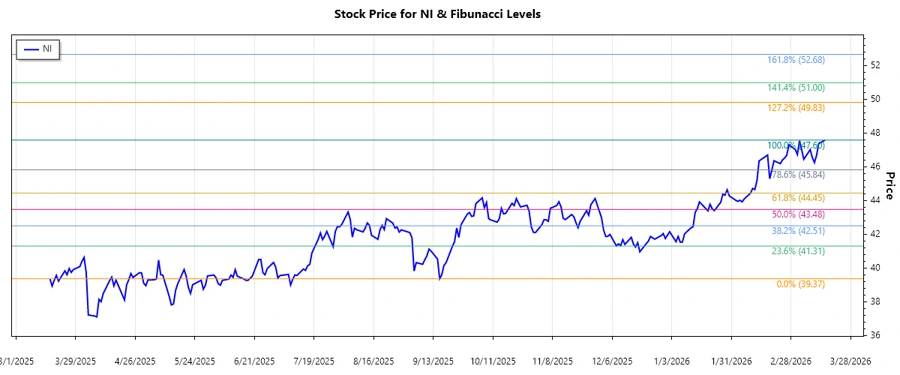
NiSource Inc., functioning as a regulated natural gas and electric utility, has demonstrated resilience in its industry. Over the observed period, the stock exhibited an upward trend from September 2025 to March 2026. Such consistent growth suggests solid investor confidence, with external factors like energy demand playing a significant role. The recent price movements indicate that NiSource's market strategy is effectively addressing contemporary utility challenges.
Fibonacci Analysis
| Metric | Details |
|---|---|
| Trend Start Date | 2025-09-16 |
| Trend End Date | 2026-03-16 |
| High Point | 47.5962 (2026-03-16) |
| Low Point | 39.37 (2025-09-16) |
| Fibonacci Levels |
|
| Current Price | 47.5962 |
| Retracement Zone | None |
| Interpretation | The current price is above all retracement levels, suggesting a strong continuation of the upward trend. The high points may act as resistance; breaking this could indicate further upside. |
Conclusion
NiSource Inc.'s stock has journeyed upwards from a low of $39.37 in September 2025 to a high of $47.5962 by March 2026. Such progression highlights robust growth potential within the utility sector, driven by strategic expansions and a steady energy demand. While current prices suggest strength, watching for potential resistances at Fibonacci levels is prudent. Analysts remain optimistic but cautious given the energy sector's volatility, recommending vigilance in tracking market conditions. Potential regulatory shifts or changes in energy consumption patterns could introduce risks, though current dynamics appear favorable.